Use these links to rapidly review the document
TABLE OF CONTENTS
INDEX TO CONSOLIDATED FINANCIAL STATEMENTS
Table of Contents
Filed Pursuant to Rule 424(b)(4)
Registration No. 333-216642
PROSPECTUS
10,500,000 Shares

COMMON STOCK
Yext, Inc. is offering 10,500,000 shares of its common stock. This is our initial public offering, and no public market currently exists for our
shares.
Our common stock has been authorized for listing on the New York Stock Exchange under the symbol "YEXT."
We are an "emerging growth company" as defined under the federal securities laws. Investing in our common stock
involves risks. See "Risk Factors" beginning on page 13.
PRICE $11.00 A SHARE
|
|
|
|
|
|
|
|
|
Price to
Public
|
|
Underwriting
Discounts and
Commissions(1)
|
|
Proceeds to
Yext
|
|
|
|
|
|
|
|
|
Per Share |
|
$11.00 |
|
$0.77 |
|
$10.23 |
Total |
|
$115,500,000 |
|
$8,085,000 |
|
$107,415,000 |
(1) See "Underwriting" for a description of compensation payable to the underwriters.
We have granted the underwriters an option to purchase up to an additional 1,575,000 shares of common stock to cover over-allotments.
The Securities and Exchange Commission and state securities regulators have not approved or disapproved of these securities or
determined if this prospectus is truthful or complete. Any representation to the contrary is a criminal offense.
The underwriters expect to deliver the shares of common stock to purchasers on April 19, 2017.
|
|
|
|
|
| MORGAN STANLEY |
|
J.P. MORGAN |
|
RBC CAPITAL MARKETS |
|
|
|
PACIFIC CREST SECURITIES
a division of KeyBanc Capital Markets |
|
PIPER JAFFRAY |
April 12, 2017
Table of Contents
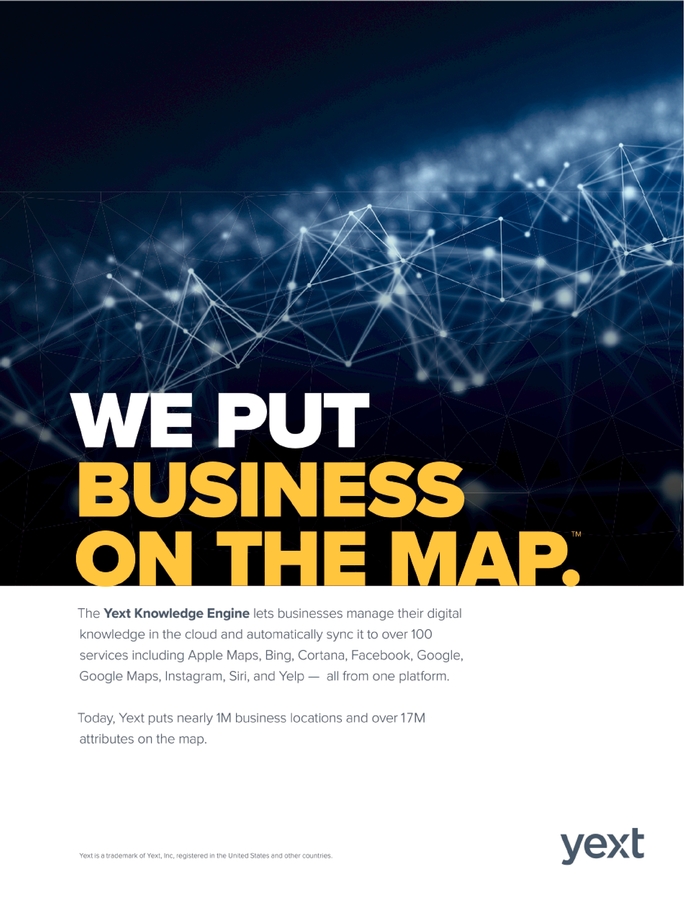
Table of Contents

Table of Contents

Table of Contents
TABLE OF CONTENTS
You
should rely only on the information contained in this prospectus and in any free writing prospectus. We and the underwriters have not authorized anyone to provide you with
information different from that contained in this prospectus. We and the underwriters are offering to sell, and seeking offers to buy, shares of our common stock only in jurisdictions where offers and
sales are permitted. The information in this prospectus is accurate only as of the date of this prospectus, regardless of the time of delivery of this prospectus or any sale of shares of our common
stock.
Through and including May 7, 2017 (the 25th day after the date of this prospectus), all dealers effecting transactions in these securities, whether
or not participating in this offering, may be required to deliver a prospectus. This delivery requirement is in addition to a dealer's obligation to deliver a prospectus when acting as an underwriter
and with respect to an unsold allotment or subscription.
Neither
we nor any of the underwriters have done anything that would permit this offering or possession or distribution of this prospectus in any jurisdiction where action for that
purpose is required, other than in the United States. Persons outside the United States who come into possession of this prospectus must inform themselves about, and observe any restrictions relating
to, the offering of the shares of common stock and the distribution of this prospectus outside of the United States.
i
Table of Contents
PROSPECTUS SUMMARY
This summary highlights information contained elsewhere in this prospectus. This summary does not contain all of the
information you should consider before buying shares in this offering. Therefore, you should read this entire prospectus carefully, including the "Risk Factors" and "Management's Discussion and
Analysis of Financial Condition and Results of Operations" sections and our consolidated financial statements and the related notes included elsewhere in this prospectus, before deciding to purchase
shares of our common stock. Unless the context requires otherwise, the words "we," "us," "our" and "Yext" refer to Yext, Inc. and its wholly owned subsidiaries.
YEXT, INC.
Overview
Yext is a knowledge engine. Our platform lets businesses manage their digital knowledge in the cloud and sync it to over 100 services,
including Apple Maps, Bing, Cortana, Facebook, Google, Google Maps, Instagram, Siri and Yelp. Digital knowledge is the structured information that a business wants to make publicly accessible. For
example, in food service, the address, phone number or menu details of a restaurant; in healthcare, the health insurances accepted by a physician or the precise drop-off point of the emergency room at
a hospital campus; or in finance, the ATM locations, retail bank holiday hours or insurance agent biographies. We believe a business is the ultimate authority on its own digital knowledge, and it is
our mission to put that business in control of it everywhere.
Intelligent
search, which are searches of digital knowledge that combine context and intent, has grown significantly in recent years. In particular, searches that return maps in the
results have grown significantly with the proliferation of mobile devices and now make up 30% of all mobile searches. For example, searches for categories, such as "restaurants", "wine", "insurance",
"wealth advisor" or "doctor", or for specific brands, such as "Marriott", "McDonald's" or "Home Depot", return maps directly in the search results. The source of the results for each of these searches
is not a web
page—it is structured data. Businesses and service providers want their information to be accurate, compelling and more prominent than that of their competitors when consumers look for
them on search platforms, applications, social media, connected devices and other digital sources. Our solution drives commerce by providing real-time digital knowledge that allows consumers to find
the businesses and service providers that are most relevant to them.
The
vast majority of digital knowledge provided by searches currently comes from third-party sources such as data aggregators, governmental agencies and consumers. The net result of this
third-party sourcing has been to produce "best guess" data that can often miss or misstate the true digital knowledge about businesses worldwide. We have built our business on the fundamental premise
that the best source of accurate and timely digital knowledge about a business is the business itself. We have established direct data integrations between our software and the over 100 members of our
PowerListings Network that end consumers around the globe use to discover new businesses, read reviews and find accurate answers to their queries. These integrations include Apple Maps, Bing,
Facebook, Google, Google Maps, Instagram, Yelp and many others. Our platform uses our patented Match & Lock process to ensure that our customers' digital knowledge is in sync across our
PowerListings Network. Businesses can directly control their own digital knowledge rather than leaving it in the hands of third parties, thereby making our platform the system of record for such vital
knowledge.
We
offer our cloud-based digital knowledge platform, the Yext Knowledge Engine, to customers on a subscription basis in several packages. Each package provides varying levels of access
to our key Listings, Pages, Reviews and other features. Our Listings feature provides customers with control over their digital presence, including their location and other related attributes
published on the most widely used third-party applications. Our Pages feature allows customers to establish landing pages on their own websites and to manage rich and compelling digital content on
those sites, including calls to action. Our Reviews
1
Table of Contents
feature
enables customers to encourage and facilitate reviews from end consumers, thereby increasing the quantity and quality of the reviews available to potential consumers and improving the search
relevance for businesses on our PowerListings Network.
Our
customers use our platform to manage their digital knowledge covering over 17 million attributes and over 925,000 locations. These customers include leading businesses
in a diverse set of industries, such as healthcare and pharmaceuticals, retail, financial services, manufacturing and technology. Our customers include AutoZone, Ben & Jerry's, Best Buy, Citi,
Denny's, Farmers Insurance Group, H&R Block, HCA, Infiniti, Marriott, Michael's, McDonald's, Rite Aid, Steward Health Care and many others.
We
believe that the market for digital knowledge management is a large and mostly untapped market. As a subset of digital knowledge, we estimate that there are currently over
100 million potential business locations and points of interest in the world that could benefit from our platform, representing an estimated addressable market, solely with respect to
locations, of approximately $10 billion annually for our existing platform in 2017. Our estimate however is subject to risks and uncertainties as described in "Risk Factors—Risks
Related to Our Business and Industry—If the assumptions we use to estimate the size of our total addressable market are inaccurate, our future growth may be affected."
We
have experienced rapid growth in recent periods. For our fiscal years ended January 31, 2015, 2016 and 2017, our revenues were $60.0 million, $89.7 million and
$124.3 million, respectively, our net loss was $17.3 million, $26.5 million and $43.2 million, respectively, and our non-GAAP net loss1 was
$14.4 million, $22.0 million and $33.3 million, respectively.
Industry Background
Consumer Discovery Has Changed. Intelligent search has grown significantly in recent years.
Businesses are now able to leverage intelligent search to
help individuals discover what they need without having to necessarily visit the business's own website and return digital knowledge, such as location and other related data, for nearly any search.
Knowledge Is Fundamental. Businesses spend significant sums on developing their brands and
creating product and market awareness. When potential
consumers reached through those efforts want to make a purchase, businesses need their digital knowledge to be widely available and correct so that they can be found efficiently. Inaccurate or
incomplete information results in lost sales opportunities, negative brand experiences and organizational inefficiencies.
Intelligent Search Drives Commerce. According to the U.S. Census Bureau, approximately 92% of
U.S. retail sales occurred at physical locations during
2016. When searching for a business, consumers need to know many relevant attributes such as the address, phone number, menu options of a restaurant or operating hours. According to Think with Google,
76% of location searches in the United States in May 2016 resulted in visits to a business within one day of the search and 28% of those searches resulted in a purchase.
Managing Digital Knowledge Is Challenging. Many businesses lack the capabilities to effectively
control, structure and manage digital knowledge
across the digital ecosystem where consumers discover businesses. This lack of management capability is due to several factors:
- •
- Lack of Control of Digital Knowledge. The vast majority of digital
knowledge currently comes from third-party sources such as data aggregators, governmental agencies and consumers. The net result
- 1
- Non-GAAP
net loss is a financial measure not calculated in accordance with accounting principles generally accepted in the United States, or GAAP. A
reconciliation of this non-GAAP measure to the most directly comparable GAAP-based measure along with a summary of the definition and material limitations of this measure are included under "Selected
Consolidated Financial Data—Non-GAAP Net Loss."
2
Table of Contents
Businesses Need to Provide Customers with Relevant and Actionable Information. When consumers
search for businesses, they expect to be able to
quickly find all of the relevant information they need about those organizations, such as a description, the nearest store if it is a chain, the actual location on a map, the ability to make an
appointment if it is a professional service provider, such as an insurance agent, or the ability to search for a menu item if it is a restaurant.
Existing Alternatives Are Inadequate. Traditional methods for managing digital knowledge about
location include paper or legacy software-based
solutions, such as word processors or spreadsheets. Simply managing and updating the few core search engines, such as Google and Bing, through these traditional methods is already very challenging,
and becomes even more so when implementing updates on newer services such as Instagram, Snapchat and Uber.
Our Solution—the Yext Knowledge Engine
We offer our Yext Knowledge Engine, a cloud-based global platform that enables businesses to control and manage their digital knowledge and make
it available through our PowerListings Network of over 100 third-party maps, apps, search engines, intelligent GPS systems, digital assistants, vertical directories and social networks in a
complete, up to date and accurate manner. Our platform serves as the system of record for the vital information used internally to execute operations and distributed externally across the web, mobile
listings, search platforms, applications, social media and connected devices that leverage intelligent search. The core of our platform is our global Knowledge Engine, which powers our Listings, Pages
and Reviews features. We currently offer subscription packages that include some or all of these and other features based on the edition purchased. The key features of our platform are as
follows:
- •
- Our Listings feature allows customers to manage their location-related data across our PowerListings Network on the most widely used maps,
apps, search engines, intelligent GPS systems, digital assistants, vertical directories and social networks from a single source.
- •
- Our Pages feature allows customers to establish landing pages for their business on their own websites, including for individual locations or
for individual professional service providers that vary by location, and to manage rich and compelling digital content on those sites, including calls to action.
- •
- Our Reviews feature enables customers to encourage and facilitate reviews from their end consumers, thereby increasing the quantity and quality
of the reviews available to potential consumers, the tools to manage their reviews from multiple sources from a single location and the ability to help strengthen their reviews across our
PowerListings Network.
3
Table of Contents
Key Benefits of Our Platform
Our global Knowledge Engine provides the following benefits depending on a customer's subscription level and enabled solutions and
features:
- •
- Control over Digital
Knowledge. Our platform is the system of record that enables our customers to control their digital knowledge and be the single source of truth
for their information everywhere. Our customers quickly gain control of their digital knowledge, such as their location data, listings and related attributes, resulting in the elimination of
inaccurate and duplicate data and the ability to seamlessly and simultaneously update data across our PowerListings Network.
- •
- Flexibility for Optimized Management of Digital Knowledge
Attributes. Our technology enables businesses to develop structured digital knowledge using standardized best practices that suit their business
needs and is optimized for search and discovery. Our solution gives businesses the ability to organize, edit and update digital knowledge based on numerous standard attribute fields, such as address
or operating hours, and increase the depth of their digital knowledge using our extensible custom fields, such as menu options or accepted insurance plans.
- •
- Direct Integrations with the Most Relevant
Services. Our platform, coupled with our PowerListings Network of over 100 maps, apps, search engines, intelligent GPS systems, digital
assistants, vertical directories and social networks, provides our customers with the ability to update their digital knowledge and content across this network with a single click.
- •
- Ability to Create Compelling Local Pages for
Consumers. Our Pages feature enables businesses to create a compelling online consumer experience utilizing rich content that accurately
represents their brands and establishes a consumer call to action. With Pages, our platform automatically creates and publishes individual pages that a business can manage, such as separate pages for
each store, insurance agent or doctor's office. Our content customization technology allows customers to publish information that is easily crawled by search engines, rich in content and optimized for
any device. Customer pages built with our Pages feature can also include calls to action, which allow customers to embed applications that permit end consumers to book an appointment with a financial
advisor or order a meal. Our software allows those calls to action to be integrated with existing enterprise systems used by the business.
- •
- Ability to Drive More Reviews and Increase Consumer
Engagement. Our Reviews feature helps our customers gather additional genuine consumer reviews, which typically raises their published overall
consumer satisfaction score by encouraging consumers who may not otherwise write reviews to do so. This increased review activity helps improve our customers' prominence in intelligent search results
on providers in our PowerListings Network and can help drive incremental sales.
- •
- Analytics. Our platform's
advanced analytics informs businesses as to their digital public presence.
- •
- Global Reach and Local
Expertise. Our platform integrates with both global and country-specific search engines and applications, accepts international address and phone
number data, and allows local employees to contribute individual expertise, providing a consumer experience that respects local languages, address formats and customs.
Our Competitive Strengths
We believe our competitive strengths include:
- •
- Leading Technology Platform. Our
solution was built from the ground up as a cloud application. As a result, our total cost of ownership for a customer is low, our deployment times are short, and we can easily deploy the latest
updates and upgrades to all of our customers via our cloud-based platform. Our platform currently supports over 17 million digital knowledge attributes such as address, business hours, menus
and professional credentials.
4
Table of Contents
- •
- Extensive PowerListings
Network. We have deep technology integrations with over 100 maps, apps, search engines, intelligent GPS systems, digital assistants,
vertical directories and social networks, such as Apple Maps, Bing, Facebook, Google, Google Maps, Instagram and Yelp. We have established strong, long-term relationships with many of our
PowerListings Network services. Direct integrations and custom application program interfaces, or APIs, between our Knowledge Engine and our PowerListings Network services position us to deliver
control and value to our customers.
- •
- Authoritative and Growing Data
Set. We provide integrated application providers and their end consumers with digital knowledge on over 17 million attributes and
over 925,000 locations as of January 31, 2017. Many of these attributes change frequently, such as holiday hours or menus, and our platform allows our customers to ensure that their
digital knowledge data is maintained accurately and is complete. This high-quality data set is valuable to apps that want to provide their users with accurate and complete information.
- •
- Focus on Product Innovation. We
have a history of adding innovative new features to our platform. For example, we initially created Listings in 2011, Pages in 2014 and Reviews in 2016. We also have expanded our platform to work with
new application types as they have emerged, such as Snapchat and Uber.
- •
- Global Footprint. We have
integrated with global search engines and map providers such as TomTom, thereby allowing our customers to control their digital knowledge data worldwide and make it available to consumers around the
globe. Our platform enables our customers to publish digital knowledge in over 160 countries and in over 90 languages and dialects. For example, an individual searching for a restaurant in Quebec
would be provided with results in French as well as in English. Our platform is also able to distinguish between differing address formats across countries.
- •
- Strong Brand and Thought
Leadership. We believe we are a recognized brand and thought leader in the field of digital knowledge management.
Growth Strategy
The key elements of our strategy include:
- •
- Grow Our Customer Base. We
believe that there is a substantial opportunity to continue to increase the size of our customer base across a broad range of industries and companies and to include more professional service
providers, such as individual doctors, insurance agents and financial services professionals, in addition to businesses. We also plan to continue to invest in our direct sales force to grow our
customer base, both domestically and internationally.
- •
- Continue to Enter Attractive Industry
Verticals. We have addressed specific industry segments, such as financial services and healthcare, and plan to continue this go-to-market
strategy.
- •
- Expand Existing Customer
Relationships. We plan to expand our relationships with existing customers. For example, some businesses may initially purchase our solution only
for their stores in a particular country. We also plan to up-sell additional features such as Pages and Reviews to existing customers, who generally start with our entry-level Listings feature.
- •
- Expand Internationally. We
believe that we have a significant opportunity to expand the use of our software outside the United States. We derived more than 6% of our revenues from non-U.S. sales in the fiscal year ended
January 31, 2017, and we believe there are substantial opportunities to increase sales to customers outside of the United States as well as to help our existing U.S.-based customers manage data
for more of their international business. We have an established presence in the United Kingdom and we intend to further expand our footprint in Europe and other regions.
- •
- Develop and Market New Products and
Features. We are committed to developing and marketing innovative capabilities for our customers to meet their digital knowledge management
needs. We
5
Table of Contents
Risks Related to Our Business
Investing in our common stock involves risk. You should carefully consider all the information in this prospectus prior to investing in our
common stock. These risks are discussed more fully in the section entitled "Risk Factors" immediately following this prospectus summary. These risks and uncertainties include, but are not limited to,
the following:
- •
- we have a history of losses and may not achieve profitability in the future;
- •
- we have a limited operating history as a digital knowledge software company, which makes it difficult to predict our future operating results;
- •
- we have recently experienced rapid growth and significant changes to our organization and structure and may not be able to effectively manage
such growth;
- •
- failure to adequately expand our sales force will impede our growth;
- •
- we are in the process of expanding our international operations, which exposes us to significant risks;
- •
- our growth depends in part on the success of our strategic relationships with existing and prospective PowerListings Network application
providers;
- •
- we do not have a long history with our subscription or pricing models and changes could adversely affect our operating results;
- •
- our success depends on a fragmented internet environment for finding information about physical business locations;
- •
- our platform faces intense competition in the marketplace;
- •
- business and professional service providers may not widely adopt our platform to manage the important aspects of their digital knowledge, which
would limit our ability to grow our business; and
- •
- because we recognize revenue from subscriptions for our platform over the term of the subscription, downturns or upturns in new business may
not be immediately reflected in our operating results.
Ownership of Capital Stock
Upon the completion of this offering, our executive officers, directors and current beneficial owners of 5% or more of our common stock,
together with their respective affiliates, will beneficially own, in the aggregate, approximately 73,807,346 shares of our common stock, or approximately 82% of our
6
Table of Contents
outstanding
common stock, assuming no exercise of the underwriters' option to purchase additional shares of our common stock in this offering.
Company Information
We were incorporated in 2006 as a Delaware corporation. Our headquarters are located at 1 Madison Avenue, 5th Floor, New York, NY 10010
and our telephone number is (212) 994-3900. You can access our website at www.yext.com. The information contained on, or that can be accessed through, our website is not part of this prospectus
or the registration statement of which it forms a part and is not incorporated by reference in this prospectus or the registration statement of which it forms a part.
"Yext"
and "PowerListings" as well as the Yext logo are registered trademarks in the United States and, in some cases, in certain other countries. Our other unregistered trademarks and
service marks in the United States include, but are not limited to, "LocationWorld" and "We put business on the map." This prospectus also contains trademarks of other persons and entities.
Implications of Being an Emerging Growth Company
We are an "emerging growth company" as defined in the Jumpstart Our Business Startups Act of 2012, or the JOBS Act. For so long as we remain an
emerging growth company, we are permitted and intend to rely on exemptions from specified disclosure and other requirements that are applicable to other public companies that are not emerging growth
companies. These exemptions include:
- •
- an exemption from the auditor attestation requirement in the assessment of our internal controls over financial reporting;
- •
- an exemption from implementation of new or revised financial accounting standards until they would apply to private companies and from
compliance with any new requirements adopted by the Public Company Accounting Oversight Board requiring mandatory audit firm rotation;
- •
- reduced disclosure obligations regarding executive compensation; and
- •
- exemptions from the requirements of holding a nonbinding advisory vote on executive compensation and stockholder approval of any golden
parachute payments not previously approved.
We
may take advantage of these provisions for up to five years or such earlier time that we are no longer an emerging growth company. We would cease to be an emerging growth company if
we have more than $1 billion in annual revenues, have more than $700 million in market value of our capital stock held by non-affiliates or issue more than $1 billion of
non-convertible debt over a three-year period. We may choose to take advantage of some, but not all, of the available exemptions.
We
have elected to take advantage of the extended transition period to comply with new or revised accounting standards and to adopt certain of the reduced disclosure requirements
available to emerging growth companies. As a result of the accounting standards election, we will not be subject to the same implementation timing for new or revised accounting standards as other
public companies that are not emerging growth companies, which may make comparison of our financials to those of other public companies more difficult. Additionally, because we have taken advantage of
certain reduced reporting requirements, the information contained herein may be different than the information you receive from other public companies in which you hold stock.
7
Table of Contents
THE OFFERING
|
|
|
Common stock offered by us |
|
10,500,000 shares |
Common stock outstanding after this offering |
|
85,489,470 shares |
Over-allotment option |
|
1,575,000 shares |
Use of proceeds |
|
We estimate that the net proceeds from our sale of shares of common stock in this offering will be approximately $103.0 million (or approximately $119.1 million if the underwriters exercise their over-allotment option in full), at the
initial public offering price of $11.00 per share, after deducting underwriting discounts and commissions and estimated offering expenses payable by us. |
|
|
We intend to use the net proceeds from this offering for working capital, capital expenditures and other general corporate purposes. We may also use a portion of our net proceeds to fund potential acquisitions of, or investments in, technologies or
businesses that complement our business, although we have no present commitments or agreements to enter into any such acquisitions or make any such investments. See "Use of Proceeds." |
New York Stock Exchange symbol |
|
"YEXT" |
Risk factors |
|
See "Risk Factors" and other information included in this prospectus for a discussion of factors you should carefully consider before deciding to invest in shares of our common stock. |
The
number of shares of common stock that will be outstanding after this offering is based on 74,989,470 shares outstanding as of January 31, 2017. This number
excludes:
- •
- 27,420,108 shares of common stock issuable upon exercise of options that were outstanding as of January 31, 2017 at a weighted-average
exercise price of $4.24 per share;
- •
- 330,000 shares of common stock issuable upon the vesting and settlement of restricted stock units that were outstanding as of
January 31, 2017;
- •
- 195,937 shares of common stock issuable upon exercise of warrants that were outstanding as of January 31, 2017 at a weighted-average
exercise price of $1.65 per share;
- •
- 799,250 shares of common stock issuable upon the exercise of options granted after January 31, 2017 at a weighted-average exercise price
of $8.64 per share;
- •
- 6,913,791 shares of common stock reserved for future issuance under our 2016 Equity Incentive Plan, which became effective in December 2016
(after giving effect to the shares of our common stock issuable upon the exercise of options to purchase 799,250 shares of common stock granted after January 31, 2017), plus any shares returned
to our 2008 Equity Incentive Plan as the result of expiration or termination of options or other awards; and
- •
- 1,500,000 shares of common stock reserved for future issuance under our 2017 Employee Stock Purchase Plan.
8
Table of Contents
We
refer to our Series A Preferred Stock, Series B Preferred Stock, Series C Preferred Stock, Series D Preferred Stock, Series E Preferred Stock and
Series F Preferred Stock herein as our "convertible preferred stock." Except as otherwise indicated, all information in this prospectus assumes:
- •
- the conversion of all outstanding shares of our convertible preferred stock into an aggregate of 43,594,753 shares of common stock, which will
occur automatically upon the closing of this offering;
- •
- the automatic conversion of outstanding warrants exercisable for shares of our convertible preferred stock into warrants exercisable for
110,937 shares of our common stock upon the closing of this offering;
- •
- the effectiveness of our amended and restated certificate of incorporation, which we will file immediately prior to the closing of this
offering;
- •
- no exercise of outstanding options and warrants and no settlement of outstanding restricted stock units; and
- •
- no exercise of the underwriters' over-allotment option.
9
Table of Contents
SUMMARY CONSOLIDATED FINANCIAL DATA
In the following tables, we provide our summary consolidated financial data. You should read the summary historical financial data set forth
below in conjunction with our consolidated financial statements, the notes to our consolidated financial statements and "Management's Discussion and Analysis of Financial Condition and Results of
Operations" included elsewhere in this prospectus. Our fiscal year ends on January 31. References to fiscal year 2017, for example, refer to the fiscal year ended January 31, 2017.
The
historical statement of operations data for the fiscal years ended January 31, 2015, 2016 and 2017 and balance sheet data as of January 31, 2017 have been derived from
our audited consolidated financial statements that are included elsewhere in this prospectus.
Our
historical results are not necessarily indicative of our future results. The summary consolidated financial data in this section are not intended to replace the consolidated
financial statements and are qualified in their entirety by the consolidated financial statements and related notes included elsewhere in this prospectus.
10
Table of Contents
|
|
|
|
|
|
|
|
|
|
|
|
|
Fiscal year ended January 31, |
|
|
|
2015 |
|
2016 |
|
2017 |
|
|
|
(in thousands, except share and per share data)
|
|
Consolidated Statement of Operations Data: |
|
|
|
|
|
|
|
|
|
|
Revenues |
|
$ |
60,002 |
|
$ |
89,724 |
|
$ |
124,261 |
|
Cost of revenues(1) |
|
|
24,832 |
|
|
31,033 |
|
|
36,950 |
|
|
|
|
|
|
|
|
|
|
|
|
|
Gross profit |
|
|
35,170 |
|
|
58,691 |
|
|
87,311 |
|
Operating expenses: |
|
|
|
|
|
|
|
|
|
|
Sales and marketing(1) |
|
|
31,588 |
|
|
49,822 |
|
|
81,529 |
|
Research and development(1) |
|
|
11,945 |
|
|
16,201 |
|
|
19,316 |
|
General and administrative(1) |
|
|
8,988 |
|
|
18,806 |
|
|
29,166 |
|
|
|
|
|
|
|
|
|
|
|
|
|
Total operating expenses |
|
|
52,521 |
|
|
84,829 |
|
|
130,011 |
|
|
|
|
|
|
|
|
|
|
|
|
|
Loss from operations |
|
|
(17,351 |
) |
|
(26,138 |
) |
|
(42,700 |
) |
Other income (expense), net |
|
|
78 |
|
|
(412 |
) |
|
(382 |
) |
|
|
|
|
|
|
|
|
|
|
|
|
Loss from operations before income taxes |
|
|
(17,273 |
) |
|
(26,550 |
) |
|
(43,082 |
) |
Benefit from (provision for) income taxes |
|
|
— |
|
|
55 |
|
|
(68 |
) |
|
|
|
|
|
|
|
|
|
|
|
|
Net loss |
|
$ |
(17,273 |
) |
$ |
(26,495 |
) |
$ |
(43,150 |
) |
|
|
|
|
|
|
|
|
|
|
|
|
|
|
|
|
|
|
|
|
|
|
|
|
|
|
|
|
|
|
|
|
|
|
|
|
Net loss per share attributable to common stockholders, basic and diluted(2) |
|
$ |
(0.61 |
) |
$ |
(0.89 |
) |
$ |
(1.39 |
) |
|
|
|
|
|
|
|
|
|
|
|
|
|
|
|
|
|
|
|
|
|
|
|
|
|
|
|
|
|
|
|
|
|
|
|
|
Weighted-average number of shares used in computing net loss per share attributable to common stockholders, basic and
diluted(2) |
|
|
28,519,917 |
|
|
29,917,814 |
|
|
31,069,695 |
|
|
|
|
|
|
|
|
|
|
|
|
|
|
|
|
|
|
|
|
|
|
|
|
|
|
|
|
|
|
|
|
|
|
|
|
|
Pro forma net loss per share attributable to common stockholders, basic and diluted (unaudited)(2) |
|
|
|
|
|
|
|
$ |
(0.58 |
) |
|
|
|
|
|
|
|
|
|
|
|
|
|
|
|
|
|
|
|
|
|
|
|
|
|
|
|
|
|
|
|
|
|
|
|
|
Weighted-average number of shares used in computing pro forma net loss per share attributable to common stockholders, basic
and diluted (unaudited)(2) |
|
|
|
|
|
|
|
|
74,664,448 |
|
|
|
|
|
|
|
|
|
|
|
|
|
|
|
|
|
|
|
|
|
|
|
|
|
|
|
|
|
|
|
|
|
|
|
|
|
- (1)
- Includes
stock-based compensation expense as follows:
|
|
|
|
|
|
|
|
|
|
|
|
|
Fiscal year ended
January 31, |
|
|
|
2015 |
|
2016 |
|
2017 |
|
|
|
(in thousands)
|
|
Cost of revenues |
|
$ |
399 |
|
$ |
533 |
|
$ |
590 |
|
Sales and marketing |
|
|
920 |
|
|
1,559 |
|
|
4,359 |
|
Research and development |
|
|
1,104 |
|
|
1,300 |
|
|
1,954 |
|
General and administrative |
|
|
480 |
|
|
1,115 |
|
|
2,948 |
|
|
|
|
|
|
|
|
|
|
|
|
|
Total stock-based compensation |
|
$ |
2,903 |
|
$ |
4,507 |
|
$ |
9,851 |
|
|
|
|
|
|
|
|
|
|
|
|
|
|
|
|
|
|
|
|
|
|
|
|
|
|
|
|
|
|
|
|
|
|
|
|
|
- (2)
- See
Note 12, "Net Loss Per Share Attributable to Common Stockholders and Unaudited Pro Forma Net Loss Per Share," to our consolidated financial statements
included elsewhere in this prospectus for an explanation of the method used to calculate basic and diluted net loss per common share attributable to common stockholders.
11
Table of Contents
The
following table presents our consolidated balance sheet data as of January 31, 2017:
- •
- on an actual basis;
- •
- on a pro forma basis to give effect to (i) the conversion of all then outstanding shares of our convertible preferred stock into an
aggregate of 43,594,753 shares of our common stock, which will occur automatically upon the closing of this offering; and (ii) the automatic conversion of outstanding warrants exercisable for
shares of our convertible preferred stock into warrants exercisable for 110,937 shares of our common stock immediately prior to the completion of this offering and the reclassification of the related
warrant liability to additional paid-in-capital; and
- •
- on a pro forma as adjusted basis to give further effect to the receipt by us of the net proceeds from the sale of 10,500,000 shares of common
stock in this offering at the initial public offering price of $11.00 per share, after deducting underwriting discounts and commissions and estimated offering expenses payable by us.
|
|
|
|
|
|
|
|
|
|
|
|
|
As of January 31, 2017 |
|
|
|
Actual |
|
Pro Forma |
|
Pro Forma As
Adjusted(1) |
|
|
|
(in thousands)
|
|
Consolidated Balance Sheet Data: |
|
|
|
|
|
|
|
|
|
|
Cash and cash equivalents |
|
$ |
24,420 |
|
$ |
24,420 |
|
$ |
127,605 |
|
Total current assets |
|
|
61,829 |
|
|
61,829 |
|
|
165,014 |
|
Total assets |
|
|
86,465 |
|
|
86,465 |
|
|
187,131 |
|
Total liabilities |
|
|
93,605 |
|
|
92,661 |
|
|
90,312 |
|
Convertible preferred stock |
|
|
120,615 |
|
|
— |
|
|
— |
|
Total stockholders' (deficit) equity |
|
|
(127,755 |
) |
|
(6,196 |
) |
|
96,819 |
|
The
pro forma as adjusted balance sheet data is presented for informational purposes only and does not purport to represent what our consolidated financial position actually would have
been had the
transactions reflected occurred on the date indicated or to project our financial condition as of any future date.
Non-GAAP Net Loss
In addition to our financial results determined in accordance with U.S. generally accepted accounting principles, or GAAP, we believe that
non-GAAP net loss is useful in evaluating our operating performance. Non-GAAP net loss is a financial measure not calculated in accordance with GAAP. We define non-GAAP net loss as our GAAP net loss
as adjusted to exclude the effects of stock-based compensation expenses. We regularly review non-GAAP net loss as we evaluate our business.
A
reconciliation of this non-GAAP measure to the most directly comparable GAAP-based measure, along with a summary of the material limitations of this measure, are included under
"Selected Consolidated Financial Data—Non-GAAP Net Loss".
|
|
|
|
|
|
|
|
|
|
|
|
|
Fiscal year ended January 31, |
|
|
|
2015 |
|
2016 |
|
2017 |
|
|
|
(in thousands)
|
|
Non-GAAP net loss |
|
$ |
(14,370 |
) |
$ |
(21,988 |
) |
$ |
(33,299 |
) |
12
Table of Contents
RISK FACTORS
An investment in our common stock offered by this prospectus involves a substantial risk of loss. You should carefully
consider these risk factors, together with all of the other information included in this prospectus, before you decide to purchase shares of our common stock. The occurrence of any of the following
risks could materially adversely affect our business, financial condition or operating
results. In that case, the trading price of our common stock could decline, and you may lose part or all of your investment.
Risks Related to Our Business and Industry
We have a history of losses and may not achieve profitability in the future.
We generated a net loss of $17.3 million, $26.5 million and $43.2 million in fiscal years 2015, 2016 and 2017,
respectively. As of January 31, 2017, we had an accumulated deficit of $166.9 million, reflecting our losses recognized historically on a GAAP basis. We will need to generate and sustain
increased revenue levels in future periods to become profitable, and, even if we do, we may not be able to maintain or increase our level of profitability. As a result, we may continue to experience
operating losses for the indefinite future. Further, we expect our operating expenses to increase over the next several years as we hire additional personnel, expand our distribution channels, develop
our technology and new features and face increased compliance costs associated with growth and entry into new markets and geographies and operations as a public company. If our revenue does not
increase to offset these and other potential increases in operating expenses, we may not be profitable in future periods. If we are unable to achieve and sustain profitability, the market price of our
common stock may significantly decrease.
We have a limited operating history as a digital knowledge software company, which makes it difficult to
predict our future operating results.
We were incorporated in 2006 and originally operated as an advertising services company. Our business has evolved several times since then. For
example, we sold our advertising business to IAC/InterActiveCorp in 2012 to focus our operations on becoming a leading digital knowledge software company. Many of the most popular features of our
platform have only been launched in the past few years. Our Listings feature was launched in 2011, our Pages feature was launched in 2014, and our Reviews feature was launched in 2016.
As
a result of our limited operating history and recent changes to our platform and our sales model, our ability to forecast our future operating results is limited and subject to a
number of uncertainties,
including our ability to plan for and model our future growth. The dynamic nature of our business and our industry may make it difficult to evaluate our current business and future prospects, and as a
result our historical performance should not be considered indicative of our future performance. We have encountered and will encounter risks and uncertainties frequently experienced by growing
companies in rapidly changing industries, such as the risks and uncertainties described in this prospectus. If our assumptions regarding these risks and uncertainties are incorrect or change due to
changes in our industry, or if we do not address these risks successfully, our operating and financial results could differ materially from our expectations and our business could suffer.
We have recently experienced rapid growth and significant changes to our organization and structure and may
not be able to effectively manage such growth.
Our headcount and operations have grown substantially in recent years. We increased the number of our full-time employees from over 450 as of
January 31, 2016 to over 630 as of January 31, 2017 and have hired several members of our senior management team in recent years.
We
believe that our corporate culture has been a critical component of our success. We have invested substantial time and resources in building our team and nurturing our culture. As we
expand our business
13
Table of Contents
and
operate as a public company, we may find it difficult to maintain our corporate culture while managing our personnel growth. Any failure to manage our anticipated growth and organizational changes
in a manner that preserves the key aspects of our culture could hurt our chance for future success, including our ability to recruit and retain personnel, and effectively focus on and pursue our
corporate objectives.
In
addition, to manage the expected growth of our headcount and operations, we will need to continue to improve our information technology infrastructure and our operational, financial
and management systems and procedures. We have implemented many of these systems and procedures only recently, and they may not work as we expect or at all. Our anticipated additional headcount and
capital investments will increase our costs, which will make it more difficult for us to address any future revenue shortfalls by reducing expenses in the short term.
Finally,
in order to successfully manage our rapid growth, our organizational structure has become more complex. We have added personnel and may need to continue to scale and adapt our
operational, financial and management controls, as well as our reporting systems and procedures. The expansion of our systems and infrastructure may require us to commit additional financial,
operational and management resources before our revenue increases and without any assurances that our revenue will increase. If we fail to successfully manage our growth, we likely will be unable to
successfully execute our business strategy, which could have a negative impact on our business, operating results and financial condition.
Failure to adequately expand our sales force will impede our growth.
Our revenue growth is substantially reliant on our sales force. Our sales process is relationship-driven, which requires a significant sales
force. While we plan to continue to expand our direct sales force, both domestically and internationally, we have historically had difficulty recruiting a sufficient number of sales personnel. If we
are unable to adequately scale our sales force, we will not be able to reach our market potential and execute our business plan.
Identifying
and recruiting qualified sales personnel and training them on our products requires significant time, expense and attention. Our financial results will suffer if our efforts
to expand and train our direct sales force do not generate a corresponding increase in revenue. In particular, if we are unable to hire, develop and retain talented sales personnel or if new direct
sales personnel are unable to achieve desired productivity levels in a reasonable period of time, we may not be able to realize the expected benefits of this investment or increase our revenue.
We are in the process of expanding our international operations, which exposes us to significant risks.
In 2014, we opened our first office outside the United States, and we intend to continue to expand our operations abroad. Our revenues from
non-U.S. operations has grown from an immaterial amount of our total revenues in fiscal year 2015 to more than 6% of our total revenues in fiscal year 2017. Our international expansion has created and
will create significant challenges for our management, administrative, operational and financial infrastructure. Operating in international markets requires significant resources and management
attention and will subject us to regulatory, economic and political risks in addition to those we already face in the United States. Because of our limited experience with international operations and
developing and managing sales in international markets, our international expansion efforts may not be successful.
Some
of the specific risks we will face in conducting business internationally that could adversely affect our business include:
- •
- the difficulty of recruiting and managing international operations and the increased operations, travel, infrastructure and legal compliance
costs associated with numerous international locations;
- •
- our ability to effectively price our multi-tiered subscriptions in competitive international markets;
14
Table of Contents
- •
- our ability to identify and manage sales partners;
- •
- new and different sources of competition in each country or region;
- •
- potentially greater difficulty collecting accounts receivable and longer payment cycles;
- •
- the need to adapt and localize our products for specific countries, including differences in the location attributes and formats used in each
country;
- •
- the need to offer customer support in various languages;
- •
- difficulties in understanding and complying with local laws, regulations and customs in foreign jurisdictions;
- •
- expanded demands on, and distraction of, senior management;
- •
- difficulties with differing technical and environmental standards, data privacy and telecommunications regulations and certification
requirements outside the United States;
- •
- varying levels of internet technology adoption and infrastructure;
- •
- tariffs and other non-tariff barriers, such as quotas and local content rules;
- •
- more limited protection for intellectual property rights in some countries;
- •
- adverse tax consequences;
- •
- fluctuations in currency exchange rates, which could increase the price of our products outside of the United States, increase the expenses of
our international operations and expose us to foreign currency exchange rate risk;
- •
- currency control regulations, which might restrict or prohibit our conversion of other currencies into U.S. dollars;
- •
- restrictions on the transfer of funds;
- •
- deterioration of political relations between the United States and other countries; and
- •
- political or social unrest or economic instability in a specific country or region in which we operate, which could have an adverse impact on
our operations in that location.
Also,
our network service provider fees outside of the United States are generally higher than domestic rates, and our gross margin may be affected and fluctuate as we expand our
operations and customer base worldwide.
Our
failure to manage any of these risks successfully could harm our international operations, and adversely affect our overall business, operating results and financial condition.
Some
of our resellers and PowerListings Network application providers also have international operations and are subject to the risks described above. Even if we are able to successfully
manage the
risks of international operations, our business may be adversely affected if these resellers and application providers are not able to successfully manage these risks.
Our growth depends in part on the success of our strategic relationships with existing and prospective
PowerListings Network application providers.
We have established strategic relationships with over 100 third-party application providers, including Apple Maps, Bing, Facebook, Google,
Google Maps, Instagram, Yelp and many others, which comprise our PowerListings Network. These application providers provide us with direct access to update content on their websites and applications.
This direct access enables us to control our customers' business listings on the PowerListings Network application providers' websites and applications and to push real-time or nearly
15
Table of Contents
real-time
updates to those business listings. If we were to lose access to these applications, either in whole or in part, our PowerListings Network would not be as efficient, accurate or competitive.
In
order to grow our business, we anticipate that we will need to continue to maintain and potentially expand these relationships. We may be unsuccessful in renegotiating our agreements
with these third-party application providers or third-party application providers may insist on fees to access their applications. Additionally, our contracts with these third-party application
providers are generally cancellable upon 30 days' notice. We believe we will also need to establish new relationships with third-party application providers, including third-party application
providers in new geographic markets that we enter, and third-party application providers that may emerge in the future as leading sources of digital knowledge for end consumers. Identifying potential
third-party application providers, and negotiating and documenting relationships with them, requires significant time and resources. Our competitors may be more effective than us in providing
incentives to application providers to favor their products or services or to prevent or reduce subscriptions to our products. In addition, the acquisition of a competitor by one of our third-party
application providers could result in the termination of our relationship with that third-party application provider, which, in turn, could lead to decreased customer subscriptions. If we are
unsuccessful in establishing or maintaining our relationships with third-party application providers, our ability to compete in the marketplace or to grow our revenues could be impaired and our
operating results could suffer.
We do not have a long history with our subscription or pricing models and changes could adversely affect our
operating results.
We have limited experience with respect to determining the optimal prices and contract length for our platform. As the markets for our features
grow, as new competitors introduce new products or services that compete with ours or reduce their prices, or as we enter into new international markets, we may be unable to attract new customers or
retain existing customers at the same price or continue to migrate customers to our multi-tiered subscription model. Moreover, large customers, which have historically been the focus of our direct
sales efforts, may demand greater price discounts.
As
we expand internationally, we also must determine the appropriate price to enable us to compete effectively internationally. In addition, if the mix of features we sell changes, then
we may need to, or choose to, revise our pricing. As a result, in the future we may be required to reduce our prices or offer shorter contract durations, which could adversely affect our revenue,
gross margin, profitability, financial condition and cash flow.
Our success depends on a fragmented internet environment for finding digital knowledge, particularly
information about physical business locations.
We believe that our Knowledge Engine offers value to our customers in part because of the difficulty for a customer to update digital knowledge,
particularly about its physical business locations and other attributes across many websites and apps, many of which are owned or controlled by different entities and receive information from a
variety of sources. Industry consolidation or technological advancements could result in a small number of websites or applications emerging as the predominant sources of digital knowledge, including
information about physical business locations, thereby creating a less fragmented internet environment for purposes of end consumer searches about physical business locations or digital knowledge
generally. Additionally, we may enter new geographies with less fragmented internet environments. If most end consumers relied on a few websites or applications for this information, or if reliably
accurate information across the most used websites and applications were generated from a single source, the need for digital business listing synchronization and our platform could decline
significantly. In particular, if larger providers of internet services were able to consolidate or control key websites and apps from which end consumers seek digital knowledge, including regarding
physical locations, our platform may become less necessary or attractive to our customers, and our revenue would suffer accordingly.
16
Table of Contents
Our platform faces competition in the marketplace. If we are unable to compete effectively, our operating
results could be adversely affected.
The market for our features is competitive, rapidly evolving and fragmented, and is subject to changing technology and shifting customer needs.
Many vendors develop and market products and services that compete to varying extents with our features, and we expect competition in our market to intensify. Moreover, industry consolidation may
increase competition. Additionally, new entrants, specifically application providers, that enter our industry through acquisitions or otherwise, would increase competition in our industry
significantly.
We
currently face many competitors with a variety of product offerings. These companies have developed, or are developing, products that currently, or in the future are likely to,
compete with some or all of our features. Also, a number of potential new competitors may have longer operating histories, greater name recognition, more established customer bases or significantly
greater financial, technical, marketing and other resources than we do. As a result, our competitors may be able to respond more quickly and effectively than we can to new or changing opportunities,
technologies, standards or customer requirements. We could lose customers if our competitors introduce new competitive products, add new features to existing competitive products, acquire competitive
products, reduce prices, form strategic alliances with other companies or are acquired by third parties with greater available resources. If our competitors' products, services or technologies become
more accepted than our features, if they are successful in bringing their products or services to market earlier than we bring our features to market, or if their products or services are more
technologically capable than our features, then our revenue growth could be adversely affected. In addition, some of our competitors offer their products and services at a lower price. If we are
unable to achieve our target pricing levels, our margins and operating results could be negatively affected.
Business and professional service providers may not widely adopt our platform to manage the important aspects
of their digital knowledge, which would limit our ability to grow our business.
Our ability to grow our business and increase revenue depends on our success in educating businesses and professional service providers about
the potential benefits of our cloud-based platform. Cloud applications for organizing and managing digital knowledge, particularly for location and location-related data, have not previously been
widely adopted. Concerns about cost, security, reliability and other issues may cause businesses and professional service providers not to adopt our
platform. Moreover, businesses and professional service providers who have already invested substantial resources in other digital knowledge and location data management systems or methods may be
reluctant to adopt a new approach like ours to supplement or replace existing systems or methods. If businesses and professional service providers do not widely adopt software such as ours, our
ability to grow our business will be limited.
Because we recognize revenue from subscriptions for our platform over the term of the subscription, downturns
or upturns in new business may not be immediately reflected in our operating results.
We generally recognize revenue from customers ratably over the terms of their agreements, which are typically one year in length but may be up
to three years or longer in length. As a result, most of the revenue we report in each quarter is the result of subscription agreements entered into during previous quarters. Consequently, a decline
in new or renewed subscriptions in any one quarter may not be reflected in our revenue results for that quarter. Any such decline, however, will negatively affect our revenue in future quarters.
Accordingly, the effect of significant downturns in sales and market acceptance of our products, and potential changes in our attrition rate, may not be fully reflected in our results of operations
until future periods. Our subscription model also makes it difficult for us to rapidly increase our revenue through additional sales in any period, as revenue from new customers must be recognized
over the applicable subscription term.
17
Table of Contents
If customers do not renew their subscriptions for our platform or reduce their subscriptions at the time of
renewal, our revenue will decline and our business will suffer.
Our customers have no obligation to renew their subscriptions for our platform after the expiration of their subscription periods. In the normal
course of business, some customers have elected not to renew their subscriptions with us. However, because our recent growth has resulted in the rapid expansion of our business and we have changed our
subscription model in recent years, we do not have a long history upon which to base forecasts of renewal rates with customers or future operating revenue. Our customers may seek to renew their
subscriptions for fewer features, at renegotiated rates, or for shorter contract lengths, all of which could reduce the amount of the subscription. Our renewal rates may decline or fluctuate as a
result of a number of factors, including limited customer resources, pricing changes, customer satisfaction with our platform, the acquisition of our customers by other companies and deteriorating
general economic conditions. If our customers do not renew their subscriptions for our platform or decrease the amounts they spend with us, our revenue will decline and our business will suffer. If
our renewal rates fall significantly below the expectations of
the public market, equity research analysts or investors, the price of our common stock could also be harmed.
If we are unable to attract new customers, our revenue growth could be slower than we expect and our business
may be harmed.
To increase our revenue, we must add new customers. If competitors introduce lower cost or differentiated products or services that are
perceived to compete with our features, our ability to sell our features based on factors such as pricing, technology and functionality could be impaired. As a result, we may be unable to attract new
customers at rates or on terms that would be favorable or comparable to prior periods, which could negatively affect the growth of our revenue.
If we fail to integrate our platform with a variety of third-party technologies, our platform may become less
marketable and less competitive or obsolete and our operating results would be harmed.
Our platform must integrate with a variety of third-party technologies, and we need to continuously modify and enhance our platform to adapt to
changes in cloud-enabled hardware, software, networking, mobile, browser and database technologies. Any failure of our platform to operate effectively with future technologies could reduce the demand
for our platform, resulting in customer dissatisfaction and harm to our business. If we are unable to respond to these changes in a cost-effective manner, our platform may become less marketable and
less competitive or obsolete and our operating results may be negatively affected. In addition, an increasing number of customers are utilizing mobile devices to access the internet and conduct
business. If we cannot continue to effectively make our platform available on these mobile devices and offer the information, services and functionality required by enterprises that widely use mobile
devices, we may experience difficulty attracting and retaining customers.
If we are unable to successfully develop and market new features, make enhancements to our existing features,
or expand our offerings into new market segments, our business, results of operations and competitive position may suffer.
The software industry is subject to rapid technological change, evolving standards and practices, as well as changing customer needs,
requirements and preferences. Our ability to attract new customers and increase revenue from existing customers depends, in part, on our ability to enhance and improve our existing features, increase
adoption and usage of our platform and introduce new features. We expend significant resources on research and development to enhance our platform
and to incorporate additional features, improve functionality or add other enhancements in order to meet our customers' rapidly evolving demands. The success of any enhancements or new features
depends on several factors, including timely completion, adequate quality testing, actual performance quality, market-accepted pricing levels
18
Table of Contents
and
overall market acceptance. We may not be successful in these efforts, which could result in significant expenditures that could impact our revenue or distract management's attention from current
offerings.
Increased
emphasis on the sale of new features could distract us from sales of our core platform, negatively affecting our overall sales. We have invested and expect to continue to
invest in new businesses, products, features, services, and technologies. Such endeavors may involve significant risks and uncertainties, including insufficient revenue from such investments to offset
any new liabilities assumed and expenses associated with these new investments, inadequate return of capital on our investments, distraction of management from current operations, and unidentified
issues not discovered in our due diligence of such strategies and offerings that could cause us to fail to realize the anticipated benefits of such investments and incur unanticipated liabilities.
Because these new strategies and offerings are inherently risky, no assurance can be given that they will be successful.
Even
if we are successful in these endeavors, diversifying our platform offerings will bring us more directly into competition with other providers that may be better established or have
greater resources than we have. Our new features or enhancements could fail to attain sufficient market acceptance for many reasons, including:
- •
- delays in introducing new, enhanced or modified features;
- •
- failure to accurately predict market demand or end consumer preferences;
- •
- defects, errors or failures in any of our features or our platform;
- •
- introduction of competing product performance or effectiveness;
- •
- poor business conditions for our customers or poor general macroeconomic conditions;
- •
- changes in the legal or regulatory requirements, or increased legal or regulatory scrutiny, adversely affecting our platform;
- •
- failure of our brand promotion activities or negative publicity about the performance or effectiveness of our existing features; and
- •
- disruptions or delays in the availability and delivery of our platform.
There
is no assurance that we will successfully identify new opportunities or develop and bring new features to market on a timely basis, or that products and technologies developed by
others will not render our platform obsolete or noncompetitive, any of which could materially and adversely affect our business and operating results and compromise our ability to generate revenues.
If our new features or enhancements do not achieve adequate acceptance in the market, or if our new features do not result in increased sales or subscriptions, our brand and competitive position will
be impaired, our anticipated revenue growth may not be achieved and the negative impact on our operating results may be particularly acute because of the upfront technology and development, marketing,
advertising and other expenses we may incur in connection with the new feature or enhancement.
If we fail to adapt and respond effectively to rapidly changing technology, evolving industry standards and
changing customer needs or requirements, our platform may become less competitive.
Our future success depends on our ability to adapt and innovate our platform. To attract new customers and increase revenue from existing
customers, we need to continue to enhance and improve our offerings to meet customer needs at prices that our customers are willing to pay. Such efforts will require adding new functionality and
responding to technological advancements, which will increase our research and development costs. If we are unable to develop new features that address our customers' needs, or to enhance and improve
our platform in a timely manner, we may not be able to maintain or increase market acceptance of our platform. Our ability to grow is also subject to the risk of future disruptive technologies. Access
and use of our platform is provided via the cloud, which, itself, was disruptive to the previous
19
Table of Contents
enterprise
software model. If new technologies emerge that are able to deliver software and related applications at lower prices, more efficiently, more conveniently or more securely, such
technologies could adversely affect our ability to compete.
If customers do not expand their use of our platform beyond their current subscriptions, our ability to grow
our business and operating results may be adversely affected.
Most of our customers currently subscribe to packages that do not include all of our features. Our ability to grow our business depends in part
on our ability to encourage current and future customers to subscribe to our higher priced packages with more extensive features. If we fail to achieve market acceptance of new features, or if a
competitor establishes a more widely adopted platform, our revenue and operating results will be harmed.
Because our platform is sold to enterprises that often have complex operating environments, we may encounter
long and unpredictable sales cycles, which could adversely affect our operating results in a given period.
Our ability to increase revenue and achieve profitability depends, in large part, on widespread acceptance of our platform by enterprises. As we
target our sales efforts at these customers, we face greater costs, longer sales cycles and less predictability in completing some of our sales. As a result of the variability and length of the sales
cycle, we have only a limited ability to forecast the timing of sales. A delay in or failure to complete sales could harm our business and financial results, and could cause our financial results to
vary significantly from period to period. Our sales cycle varies widely, reflecting differences in potential customers' decision-making processes, procurement requirements and budget cycles, and is
subject to significant risks over which we have little or no control, including:
- •
- customers' budgetary constraints and priorities;
- •
- the timing of customers' budget cycles;
- •
- the need by some customers for lengthy evaluations prior to purchasing products; and
- •
- the length and timing of customers' approval processes.
Our
typical direct sales cycles for more substantial enterprise customers can often be long, and we expect that this lengthy sales cycle may continue or could even increase. Longer sales
cycles could cause our operating results and financial condition to suffer in a given period. If we cannot adequately scale our direct sales force, we will experience further delays in signing new
customers, which could slow our revenue growth.
A portion of our revenue is dependent on a few customers.
In fiscal years 2016 and 2017, our top five customers, which included third-party resellers, accounted for approximately 22% and 18%,
respectively, of our revenues. We anticipate that sales of our platform to a relatively small number of customers will continue to account for a significant portion of our revenue in future periods.
If we were to lose any of our significant customers, our revenue could decline and our business and results of operations could be materially and adversely affected. These negative effects could be
exacerbated by customer consolidation, changes in technologies or solutions used by customers, changes in demand for our features, selection of suppliers other than us, customer bankruptcies or
customer departures from their respective industries, pricing competition or deviation from marketing and sales methods away from physical location retailing, any one of which may result in even fewer
customers accounting for a high percentage of our revenue and reduced demand from any single significant customer.
In
addition, some of our customers have used, and may in the future use, the size and relative importance of their purchases to our business to require that we enter into agreements with
more
20
Table of Contents
favorable
terms than we would otherwise agree to, to obtain price concessions, or to otherwise restrict our business.
A significant portion of our revenue is dependent on third-party resellers, the efforts of which we do not
control.
We are dependent on the efforts of third parties who resell our packages for a significant portion of our revenue. We currently work with more
than 3,500 resellers. In fiscal years 2015 and 2016, one reseller, Dex Media, accounted for 12% and 10% of our revenues, respectively. No single customer accounted for more than 10% of our revenue for
fiscal year 2017. We do not control the efforts of these resellers. If they fail to market or sell our platform successfully, merge or consolidate with other businesses, declare bankruptcy or depart
from their respective industries, our business could be harmed. Also, we may expend significant resources managing these reseller relationships. Further, in some international markets, we grant
resellers the exclusive right to sell our features. If resellers to whom we have granted exclusive rights fail to successfully market and sell our platform in their assigned territories, then we may
be unable to adequately address sales opportunities in that territory. If we are unable to maintain or replace our contractual relationships with resellers, efficiently manage our relationships with
them or establish new contractual relationships with other
third parties, we may fail to retain subscribers or acquire potential new subscribers and may experience delays and increased costs in adding or replacing subscribers that were lost, any of which
could materially affect our business, operating results and financial condition.
Our revenue growth rate in recent periods may not be indicative of our future performance.
We experienced revenue growth rates of 50% from fiscal year 2015 to fiscal year 2016 and 38% from fiscal year 2016 to fiscal year 2017. Our
historical revenue growth rates are not indicative of future growth, and we may not achieve similar revenue growth rates in future periods. You should not rely on our revenue for any prior quarterly
or annual periods as an indication of our future revenue or revenue growth. Our operating results may vary as a result of a number of factors, including our ability to execute on our business strategy
and compete effectively for customers and business partners and other factors that are outside of our control. If we are unable to maintain consistent revenue or revenue growth, our stock price could
be volatile, and it could be difficult to achieve or maintain profitability.
A security breach, network attack or information security incident could delay or interrupt service to our
customers, result in the unauthorized access to, or use, modification or publishing of customer content or other information, harm our reputation or subject us to significant liability.
We are vulnerable to computer viruses, break-ins, phishing attacks, attempts to overload our servers with denial-of-service or other attacks and
similar disruptions from unauthorized use of our computer systems. Any such attack, or any information security incident from any other source affecting us or our services providers, including through
employee error or misconduct, could lead to interruptions, delays, website or application shutdowns, loss of data or unauthorized access to, or use or acquisition of, personal information,
confidential information or other data that we or our services providers process or maintain.
For
example, in December 2015, we suffered a denial-of-service attack, which resulted in the inability for some of our customers to access our platform for several hours. If we
experience additional compromises to our security that result in performance or availability problems, the complete shutdown of our platform or the loss of, or unauthorized access to, personal
information or other types of confidential information, our customers or application providers may assert claims against us for credits, refunds or other damages, and may lose trust and confidence in
our platform. Additionally, security breaches or other unauthorized access to, or use or acquisition of, personal information or other types of confidential information that we or our services
providers maintain, could result in claims against us for identity theft or other similar fraud claims, governmental enforcement actions, litigation, fines and penalties or adverse publicity, and
could cause our customers and partners to lose trust in us, any of which could have an adverse effect on our business, reputation, operating results and financial condition. Because the
21
Table of Contents
techniques
used to obtain unauthorized access, disable or degrade service or sabotage systems change frequently, often are not recognized until launched against a target and may originate from less
regulated countries, we may be unable to proactively address these techniques or to implement adequate preventative measures.
In
addition, customers' and application providers' accounts and listing pages hosted on our platform could be accessed by unauthorized persons for the purpose of placing illegal, abusive
or otherwise unauthorized content on their respective websites and applications. If an unauthorized person obtained access to a customer's account, such person could update the customer's business
information with abusive content. This type of unauthorized activity could negatively affect our ability to attract new customers and application providers, deter current customers and application
providers from using our platform, subject us to third-party lawsuits, regulatory fines, indemnification requests or additional liability under customer contracts, or other action or liability, any of
which could materially harm our business, operating results and financial condition.
In connection with the preparation of our consolidated financial statements in recent years, we and our
independent registered public accounting firm identified material weaknesses in our internal control over financial reporting. If we are not able to remediate the material weaknesses and otherwise to
maintain an effective system of internal control over financial reporting, the reliability of our financial reporting, investor confidence in us and the value of our common stock could be materially
and adversely affected.
As a public company, we will be required to maintain internal control over financial reporting and to report any material weaknesses in such
internal controls. Section 404 of the Sarbanes-Oxley Act of 2002, or Section 404, requires that we evaluate and determine the effectiveness of our internal control over financial
reporting and, beginning with our second annual report following this offering, which will cover our fiscal year ending January 31, 2019, provide a management report on internal control over
financial reporting. Under standards established by the United States Public Company Accounting Oversight Board, a material weakness is a deficiency, or combination of deficiencies, in internal
control over financial reporting such that there is a reasonable possibility that a material misstatement of annual or interim financial statements will not be prevented or detected and corrected on a
timely basis.
In
connection with the audits of fiscal years 2016 and 2017 financial statements, we and our independent registered public accounting firm identified two material weaknesses in our
controls. The first material weakness pertained to controls over the revenue recognition process resulting from a lack
of logical access controls over our revenue system and the lack of review controls with regard to manual revenue adjustments. Specifically, we did not have
adequate:
- •
- policies and controls to restrict access to customer accounts and accounting records;
- •
- policies to amend customer agreements; and
- •
- controls around determining service start dates.
We
also identified a significant reliance on manual processes in our customer order entry procedures. We are working to remediate the material weakness and have taken steps to improve our internal
control environment, including implementing procedures and controls designed to improve our revenue recognition process. Specifically, we are:
- •
- implementing IT controls to prevent unauthorized access or changes to our business applications;
- •
- implementing additional preventative controls around the contracting and provisioning processes;
- •
- implementing additional detective controls around the revenue recognition process, including analytical reviews to assess completeness and
accuracy of revenue; and
22
Table of Contents
- •
- documenting, assessing and testing our internal control over financial reporting as part of our efforts to comply with Section 404.
Also
in connection with our audits of the fiscal year 2016 and 2017 consolidated financial statements, we and our independent registered public accounting firm identified a second
material weakness, primarily related to the lack of review and oversight over financial reporting. We determined that we had insufficient financial statement close processes and procedures, including
the classification and presentation of expenses. We are taking steps to remediate this weakness, including hiring of senior accounting personnel in our internal audit group and controller's group with
a focus on SEC reporting and technical accounting.
We
cannot at this time estimate how long it will take to remediate these material weaknesses, and we may not ever be able to remediate the material weaknesses. If we are unable to
successfully remediate the material weaknesses and otherwise to establish and maintain an effective system of internal control over financial reporting, the reliability of our financial reporting,
investor confidence in us and the value of our common stock could be materially and adversely affected. Additionally, the process of designing and implementing internal control over financial
reporting required to comply with Section 404 will be time consuming, costly and complicated. In addition, we may discover other control deficiencies in the future, and we cannot assure you
that we will not have a material weakness in future periods.
Effective
internal control over financial reporting is necessary for us to provide reliable and timely financial reports and, together with adequate disclosure controls and procedures,
are designed to reasonably detect and prevent fraud. Any failure to implement required new or improved controls, or difficulties encountered in their implementation could cause us to fail to meet our
reporting obligations. For as long as we are an "emerging growth company" under the Jumpstart Our Business Startups Act of 2012, or the JOBS Act, our independent registered public accounting firm will
not be required to attest to the effectiveness of our internal control over financial reporting pursuant to Section 404. We could be an "emerging growth company" for up to five years. An
independent assessment of the effectiveness of our internal control over financial reporting could detect problems that our management's assessment might not. Undetected material weaknesses in our
internal control over financial reporting could lead to financial statement restatements and require us to incur the expense of remediation. Deficiencies in our internal control over financial
reporting that are identified in such assessments may be deemed to be material weaknesses or may require prospective or retroactive changes to our financial statements or identify other areas for
further attention or improvement.
We may acquire other companies or technologies, which could divert our management's attention, result in
additional dilution to our stockholders and otherwise disrupt our operations and adversely affect our operating results.
We have in the past acquired and may in the future seek to acquire or invest in businesses, features or technologies that we believe could
complement or expand our platform, enhance our technical capabilities or otherwise offer growth opportunities. The pursuit of potential acquisitions may divert the attention of management and cause us
to incur various expenses in identifying, investigating and pursuing suitable acquisitions, whether or not they are consummated.
Although
we have previously acquired businesses, we have limited acquisition experience. If we acquire additional businesses, we may not be able to integrate the acquired personnel,
operations and technologies successfully or effectively manage the combined business following the acquisition. We also may not achieve the anticipated benefits from the acquired business due to a
number of factors, including:
- •
- unanticipated liabilities associated with the acquisition;
- •
- difficulty incorporating acquired technology and rights into our platform and of maintaining quality and security standards consistent with our
brand;
- •
- inability to generate sufficient revenue to offset acquisition or investment costs;
23
Table of Contents
- •
- incurrence of acquisition-related costs;
- •
- difficulties and additional expenses associated with supporting legacy products and hosting infrastructure of the acquired business;
- •
- difficulty converting the customers of the acquired business into our customers;
- •
- diversion of management's attention from other business concerns;
- •
- adverse effects to our existing business relationships as a result of the acquisition;
- •
- potential loss of key employees;
- •
- use of resources that are needed in other parts of our business; and
- •
- use of substantial portions of our available cash to consummate the acquisition.
In
addition, a significant portion of the purchase price of companies we acquire may be allocated to acquired goodwill and other intangible assets, which must be assessed for impairment
at least annually. In the future, if our acquisitions do not yield expected returns, we may be required to take charges to our operating results based on this impairment assessment process, which
could adversely affect our results of operations.
Acquisitions
could also result in dilutive issuances of equity securities or the incurrence of debt, which could adversely affect our operating results. If an acquired business fails to
meet our expectations, our business, operating results and financial condition may suffer.
Assertions by third parties of infringement or other violations by us of their intellectual property rights
could result in significant costs and harm our business and operating results.
Patent and other intellectual property disputes are common in our industry. Some companies, including some of our competitors, own large numbers
of patents, copyrights and trademarks, which they may use to assert claims against us. In addition, because patent applications can take years to issue and are often afforded confidentiality for some
period of time, there may currently be pending applications, unknown to us, that later result in issued patents that could cover one or more of our features.
Third
parties may in the future assert claims of infringement, misappropriation or other violations of intellectual property rights against us. If asserted, we cannot assure you that an
infringement claim will be successfully defended. Certain third parties have substantially greater resources than we have and may be able to sustain the costs of intellectual property litigation for
longer periods of time than we can. A successful claim against us could require that we pay substantial damages or ongoing royalty payments, prevent us from offering our platform, or require that we
comply with other unfavorable terms. We may also be obligated to indemnify our customers or business partners or pay substantial settlement costs, including royalty payments, in connection with any
such claim or litigation and to obtain licenses, modify applications or refund fees, which could be costly. Even if we were to prevail in such a dispute, any litigation regarding our intellectual
property could be costly and time-consuming and divert the attention of our management and key personnel from our business operations.
We could incur substantial costs in protecting or defending our intellectual property rights, and any failure
to protect our intellectual property could adversely affect our business, results of operations and financial condition.
Our success depends, in part, on our ability to protect our proprietary methods and technologies. There can be no assurance that the particular
forms of intellectual property protection that we seek, including business decisions about when to file trademark applications and patent applications, will be adequate to protect our business. We
intend to continue to file and prosecute patent applications when appropriate to attempt to protect our rights in our proprietary technologies. However, there can be no assurance that our patent
applications will be approved, that any patents issued will adequately protect our intellectual property, that the scope of the claims in our issued patents will be sufficient or have the coverage
originally sought, that our issued patents will provide us with any competitive advantages, or that such patents will not be challenged by third parties or found by a judicial authority to be invalid
or unenforceable.
24
Table of Contents
We could be required to spend significant resources to monitor and protect our intellectual property rights. Litigation may be necessary in the future to enforce
our intellectual property rights, determine the validity and scope of our proprietary rights or those of others, or defend against claims of infringement or invalidity. Such litigation may fail, and
even if successful, could be costly, time-consuming and distracting to management and could result in a diversion of significant resources. Our efforts to enforce our intellectual property rights may
be met with defenses, counterclaims and countersuits attacking the validity and enforceability of our intellectual property rights or alleging that we infringe the counterclaimant's own intellectual
property. An adverse determination of any litigation or defense proceedings could put our intellectual property at risk of being invalidated or interpreted narrowly and could put our related pending
patent applications at risk of not being issued. Furthermore, because of the substantial amount of discovery required in connection with intellectual
property litigation, there is a risk that some of our confidential or sensitive information could be compromised by disclosure in the event of litigation. During the course of litigation there could
be public announcements of the results of hearings, motions or other interim proceedings or developments. If securities analysts or investors perceive these results to be negative, it could have a
substantial adverse effect on the price of our common stock.
Any
of our patents, copyrights, trademarks or other intellectual property rights could be challenged by others or invalidated through administrative process or litigation. Furthermore,
there can be no guarantee that others will not independently develop similar products, duplicate any of our products or design around our patents.
We
also rely, in part, on confidentiality agreements with our employees, consultants, advisors, customers and others in our efforts to protect our proprietary technology, processes and
methods. These agreements may not effectively prevent disclosure of our confidential information, and it may be possible for unauthorized parties to copy our software or other proprietary technology
or information, or to develop similar software independently without our having an adequate remedy for unauthorized use or disclosure of our confidential information. In addition, others may
independently discover our trade secrets and proprietary information, and in these cases we would not be able to assert any trade secret rights against those parties. Costly and time-consuming
litigation could be necessary to enforce and determine the scope of our proprietary rights, and failure to obtain or maintain trade secret protection could adversely affect our competitive business
position.
In
addition, the laws of some countries do not protect intellectual property and other proprietary rights to the same extent as the laws of the United States. To the extent we expand our
international activities, our exposure to unauthorized copying, transfer and use of our proprietary technology or information may increase. For example, many foreign countries have compulsory
licensing laws under which a patent owner must grant licenses to third parties. In addition, many countries limit the enforceability of patents against third parties, including government agencies or
government contractors. In these countries, patents may provide limited or no benefit. Proceedings to enforce our patent rights in foreign jurisdictions could result in substantial costs and divert
our efforts and attention from other aspects of our business. Accordingly, our efforts to protect our intellectual property rights in such countries may be inadequate. In addition, changes in the law
and legal decisions by courts in the United States and foreign countries may affect our ability to obtain adequate protection for our technology and the enforcement of intellectual property.
We
cannot be certain that our means of protecting our intellectual property and proprietary rights will be adequate or that our competitors will not independently develop similar
technology. If we fail to meaningfully protect our intellectual property and proprietary rights, our business, operating results and financial condition could be adversely affected.
25
Table of Contents
Our platform utilizes open source software, and any failure to comply with the terms of one or more of these
open source licenses could negatively affect our business.
Our platform utilizes software governed by open source licenses. The terms of various open source licenses have not been interpreted by United
States courts, and there is a risk that such licenses could be construed in a manner that imposes unanticipated conditions or restrictions on our ability to market our platform. By the terms of
certain open source licenses, we could be required to release the source code of our proprietary software, and to make our proprietary software available under open source licenses, if we combine our
proprietary software with open source software in a specified manner. In the event that portions of our proprietary software are determined to be subject to an open source license, we could be
required to publicly release the affected portions of our source code, or to re-engineer all or a portion of software, each of which could reduce or eliminate the value of our platform. In addition to
risks related to license requirements, usage of open source software can lead to greater risks than use of third-party commercial software, as open source licensors generally do not provide warranties
or controls on the origin of the software. Many of the risks associated with usage of open source software cannot be eliminated and could negatively affect our business.
We employ third-party licensed software for use in or with our platform, and the inability to maintain these
licenses or errors in the software we license could result in increased costs, or reduced service levels, which could adversely affect our business.
Our platform incorporates certain third-party software obtained under licenses from other companies. We anticipate that we will continue to rely
on such third-party software and development tools in the future. Although we believe that there are commercially reasonable alternatives to the third-party software we currently license, this may not
always be the case, or it may be difficult or costly to replace. In addition, integration of the software used in our platform with new third-party software may require significant work and require
substantial investment of our time and resources. Also, to the extent that our platform depends upon the successful operation of third-party software in conjunction with our software, any undetected
errors or defects in this third-party software could prevent the deployment or impair the functionality of our platform, delay new feature introductions, result in a failure of our platform and injure
our reputation. Our use of additional or alternative third-party software would require us to enter into license agreements with third parties.
We are subject to general litigation that may materially adversely affect us.
From time to time, we may be involved in disputes or regulatory inquiries that arise in the ordinary course of business. We expect that the
number and significance of potential disputes may increase as our business expands and our company grows larger. While our agreements with customers limit our liability for damages arising from our
platform, we cannot assure you that these contractual provisions will protect us from liability for damages in the event we are sued. Although we carry general liability insurance coverage, our
insurance may not cover all potential claims to which we are exposed or may not be adequate to indemnify us for all liability that may be imposed. Any claims against us, whether meritorious or not,
could be time-consuming, result in costly litigation, require significant amounts of management time, and result in the diversion of significant operational resources. Because litigation is inherently
unpredictable, we cannot assure you that the results of any of these actions will not have a material adverse effect on our business, operating results or financial condition.
We
are currently a party to a lawsuit alleging deceptive sales practices by us as further described in "Business—Legal Proceedings." On April 11, 2017, we entered into
a settlement agreement pursuant to which the case will be dismissed with prejudice.
26
Table of Contents
We are subject to governmental regulation and other legal obligations, including those related to privacy,
data protection and information security, and our actual or perceived failure to comply with such obligations could harm our business. Compliance with such laws could also impair our efforts to
maintain and expand our customer base, and thereby decrease our revenue.
We receive, store and process personal information and other data from and about customers, including resellers, partners and, in limited
instances, end users of our services, in addition to our employees and services providers. Also, in connection with future feature offerings, we may receive, store and process additional types of
data, including personally identifiable information, related to end consumers. Our handling of data is subject to a variety of laws and regulations, including regulation by various government
agencies, such as the U.S. Federal Trade Commission, or FTC, and various state, local and foreign agencies. Our data handling also is subject to contractual obligations and industry standards.
The
U.S. federal and various state and foreign governments have adopted or proposed limitations on the collection, distribution, use and storage of data relating to individuals,
including the use of contact information and other data for marketing, advertising and other communications with individuals and businesses. In the United States, various laws and regulations apply to
the collection, processing, disclosure, and security of certain types of data. Additionally, the FTC and many state attorneys general are interpreting federal and state consumer protection laws as
imposing standards for the online collection, use, dissemination and security of data. The laws and regulations relating to privacy and data security are evolving, can be subject to significant change
and may result in ever-increasing regulatory and public scrutiny and escalating levels of enforcement and sanctions.
In
addition, several foreign countries and governmental bodies, including the European Union, have laws and regulations dealing with the handling and processing of personal information
obtained from their residents, which in certain cases are more restrictive than those in the United States. Laws and regulations in these jurisdictions apply broadly to the collection, use, storage,
disclosure and security of various types of data, including data that identifies or may be used to identify an individual, such as names, email addresses and in some jurisdictions, Internet Protocol,
or IP, addresses. Such laws and regulations may be modified or subject to new or different interpretations, and new laws and regulations may be enacted in the future. Within the European Union,
legislators recently adopted the General Data Protection Regulation, or GDPR, which, when effective in 2018, will replace the 1995 European Union Data Protection Directive and supersede
applicable EU member state legislation. The GDPR includes more stringent operational requirements for processors and controllers of personal data and imposes significant penalties for non-compliance.
We have certified under the U.S.-European Union Privacy Shield with respect to our transfer of certain personal data from the European Union to the United States.
We
also handle credit card and other personal information. Due to the sensitive nature of such information, we have implemented policies and procedures to preserve and protect our data
and our customers' data against loss, misuse, corruption, misappropriation caused by systems failures, unauthorized access or misuse. Notwithstanding these policies, we could be subject to liability
claims by individuals and customers whose data resides in our databases for the misuse of that information. If we fail to meet appropriate compliance levels, this could negatively impact our ability
to collect and store credit card information, which could disrupt our business.
Any
failure or perceived failure by us to comply with laws, regulations, policies, legal or contractual obligations, industry standards, or regulatory guidance relating to privacy or
data security, may result in governmental investigations and enforcement actions, litigation, fines and penalties or adverse publicity, and could cause our customers and partners to lose trust in us,
which could have an adverse effect on our reputation and business. We expect that there will continue to be new proposed laws, regulations and industry standards relating to privacy, data protection,
marketing, consumer communications and information security in the United States, the European Union and other jurisdictions, and we cannot determine the impact such future laws, regulations and
standards may have on our business. Future laws, regulations, standards and other obligations or any changed interpretation of existing laws or regulations
27
Table of Contents
could
impair our ability to develop and market new features and maintain and grow our customer base and increase revenue. Future restrictions on the collection, use, sharing or disclosure of data or
additional requirements for express or implied consent of our customers, partners or end consumers for the use and disclosure of such information could require us to incur additional costs or modify
our platform, possibly in a material manner, and could limit our ability to develop new features. If our policies, procedures, or measures relating to privacy, data protection, marketing, or customer
communications fail to comply with laws, regulations, policies, legal obligations or industry standards, we may be subject to governmental enforcement actions, litigation, regulatory investigations,
fines, penalties and negative publicity and could cause our application providers, customers and partners to lose trust in us, which could materially affect our business, operating results and
financial condition.
The reliability of our network and support infrastructure will be critical to our success. Sustained failures
or outages could lead to significant costs and service disruptions, which could negatively affect our business, financial results and reputation.
Our reputation and ability to attract, retain, and serve our customers and application providers are dependent upon the reliable performance of
our platform and our underlying technical and network infrastructure. Our customers access our platform through our website and related technologies. We rely on internal systems and third-party
vendors, including data center, bandwidth and telecommunications equipment providers, to maintain the availability of our platform. Our primary data center is in New Jersey, and our backup data center
is in Texas. If these data centers become unavailable to us without sufficient advance notice, we would likely experience delays in delivering our platform until we could migrate to an alternate data
center provider. Our disaster recovery program contemplates transitioning our platform to our backup center in the event of a catastrophe, but we have not yet fully tested the procedure, and our
platform may be unavailable, in whole or in part, during any transition procedure.
We
have experienced, and will in the future experience, interruptions, outages and other performance problems. Such disruptions may be due to a variety of factors, including
infrastructure changes, human or software errors, capacity constraints due to an overwhelming number of customers and partners accessing our platform simultaneously and inadequate design. In some
instances, we may not be able to identify the cause or causes of these performance problems within an acceptable period of time. If we do not accurately predict our infrastructure requirements, our
existing customers may experience service outages that may subject us to financial penalties, financial liabilities and customer losses. If our operations infrastructure fails to keep pace with
increased sales, customers may experience delays as we seek to obtain additional capacity, which could materially affect our business, operating results and financial condition.
Natural disasters and other events beyond our control could adversely affect us.
Natural disasters or other catastrophic events may cause damage or disruption to our operations and the global economy, and thus could have a
strong negative effect on us. Our business operations are subject to interruption by natural disasters, fire, power shortages, pandemics and other events beyond our control. Although we maintain
crisis management and disaster response plans, such events could make it difficult or impossible for us to continue operations, and could decrease demand for our platform. Our data centers are located
in New Jersey and Texas, making our business particularly susceptible to natural disasters in those areas. Any natural disaster affecting our data centers could have an adverse effect on our financial
condition and operating results.
Real or perceived errors, failures or bugs in our software, or in the software or systems of our third-party
applications providers and partners, could materially and adversely affect our operating results and growth prospects.
Our features are highly technical and complex. Our software has previously contained, and may now or in the future contain, undetected errors,
bugs, or vulnerabilities. Some errors in our software may only be discovered after the software has been deployed. Any errors, bugs, or vulnerabilities discovered in our
28
Table of Contents
software
after it has been deployed could result in damage to our reputation, loss of customers, partners or application providers, loss of revenue or liability for damages.
In
addition, the proper functioning of our platform is dependent on the ability of our PowerListings Network application providers and partners to maintain the availability and proper
functioning of their software integrations with our systems and also is dependent on the ability of our third-party applications providers to maintain the availability and proper functioning of their
websites and applications on which business listing information is published for customers. For example, a number of our PowerListings Network application providers provide us with an Application
Program Interface, or API, on which our ability to interface with that provider is based. If our PowerListings Network application providers do not maintain the availability and proper functioning of
their software, APIs, websites and applications, our business, operating results and financial condition could be materially affected.
We depend on our senior management team and the loss of our chief executive officer, president or one or more
key employees could adversely affect our business.
Our success depends largely upon the continued services of our key executive officers. In particular, two of our co-founders, Howard Lerman and
Brian Distelburger, who serve as our Chief Executive Officer and President, respectively, are critical to our vision, strategic direction, feature innovation, culture and overall business success. We
also rely on our leadership team in the areas of research and development, marketing, sales, services and general and administrative functions. From time to time, there may be changes in our executive
management team resulting from the hiring or departure of executives, which could disrupt our business. We do not have employment agreements with our executive officers or other key personnel that
require them to continue to work for us for any specified period and, therefore, they could terminate their employment with us at any time. The loss of one or more of our executive officers or key
employees could have a serious adverse effect on our business.
The failure to attract and retain additional qualified personnel could prevent us from executing our business
strategy.
To execute our business strategy, we must attract and retain highly qualified personnel. In particular, we compete with many other companies for
software developers with high levels of experience in designing, developing and managing cloud-based software, as well as for skilled information technology, sales, marketing, legal and accounting
professionals, and we may not be successful in attracting and retaining the professionals we need. In the future, we may experience difficulty in hiring and difficulty in retaining highly skilled
employees with appropriate qualifications. We face intense competition for qualified individuals from numerous software and other technology companies. Competition for qualified personnel is
particularly intense in the New York area. We may incur significant costs to attract and retain qualified personnel, and we may lose new employees to our competitors or other technology companies
before we capitalize the benefit of our investment in recruiting and training them.
In
addition, in making employment decisions, particularly in the software industry, job candidates often consider the value of the stock options or other equity incentives they are to
receive in connection with their employment. If the price of our stock declines, or experiences significant volatility, our ability to attract or retain key employees will be adversely affected. Also,
as employee options vest and lock-ups expire, we may have difficulty retaining key employees. If we fail to attract new personnel or fail to retain and motivate our current personnel, our growth
prospects could be severely harmed.
If we fail to offer high-quality customer support, our business and reputation may suffer.
High-quality education, training and customer support is important for the successful retention of existing customers. Providing this education,
training and support requires that our support personnel have specific knowledge and expertise of our platform, making it more difficult for us to hire qualified personnel and to scale up our support
operations. The importance of high-quality customer support will increase as
29
Table of Contents
we
expand our business and pursue new customers. If we do not provide effective and timely ongoing support, our ability to sell additional features to, or to retain, existing customers may suffer, and
our reputation with existing or potential customers may be harmed.
If we fail to continue to develop our brand, our business may suffer.
We believe that continuing to develop and maintain awareness of our brand is critical to achieving widespread acceptance of our platform and is
an important element in attracting and retaining customers. Efforts to build our brand may involve significant expense and may not generate customer awareness or increase revenue at all, or in an
amount sufficient to offset expenses we incur in building our brand. In addition, we sell our features to companies in a number of industries, including healthcare, financial and retail. If we are not
successful in building our brand, we may become identified with a single industry, which could make it more difficult for us to penetrate other industries.
Promotion
and enhancement of our brand will depend largely on our success in being able to provide high quality, reliable and cost-effective features. If customers do not perceive our
platform as meeting their needs, or if we fail to market our platform effectively, we will likely be unsuccessful in creating the brand awareness that is critical for broad customer adoption of our
platform.
Adverse economic conditions or reduced technology spending may adversely impact our business.
Our business depends on the overall demand for technology and on the economic performance of our current and prospective customers. In general,
worldwide economic conditions may remain unstable, and these conditions would make it difficult for our customers, prospective customers and us to forecast and plan future business activities
accurately, and they could cause our customers or prospective customers to reevaluate their decision to purchase our features. Weak global economic conditions, or a reduction in technology spending
even if economic conditions stabilize, could adversely impact our business and results of operations in a number of ways, including longer sales cycles, lower prices for our platform, fewer
subscriptions and lower or no growth.
Unanticipated changes in our effective tax rate may impact our financial results.
We are subject to income taxes in the United States and various jurisdictions outside of the United States, and we are in the process of
expanding our international operations. Our effective tax rate could fluctuate due to changes in the mix of earnings and losses in countries with differing statutory tax rates. Our tax expense could
also be impacted by changes in non-deductible expenses, changes in accounting principles, expiration or non-utilization of net operating losses, changes in excess tax benefits related to exercises and
vesting of stock-based expense, changes in the valuation of deferred tax assets and liabilities and our ability to utilize them and the applicability of withholding taxes. While we regularly evaluate
new information that may change our judgment resulting in recognition, derecognition or change in measurement of a tax position taken, there can be no assurance that the final determination of any
examinations will not have an adverse effect on our business, operating results or financial condition.
We may have additional tax liabilities, which could harm our business, results of operations or financial
condition.
Significant judgments and estimates are required in determining the provision for income taxes and other tax liabilities. We generally conduct
our international operations through wholly-owned subsidiaries and report our taxable income in various jurisdictions worldwide based upon our business operations in those jurisdictions. The amount of
taxes we pay may depend on the application of the tax laws of various jurisdictions, including the United States, to our international business activities, changes in tax rates, new or revised tax
laws or interpretations of existing tax laws and policies and our ability to operate our business in a manner consistent with our corporate structure and intercompany arrangements. Our tax expense may
be impacted if our intercompany transactions, which are required to be computed on an
30
Table of Contents
arm's-length
basis, are challenged and successfully disputed by the tax authorities. In determining the adequacy of income taxes, we assess the likelihood of adverse outcomes that could result if our
tax positions were challenged by the Internal Revenue Service, or IRS, and other tax authorities. The tax authorities in the United States and other countries where we do business regularly examine
our income and other tax returns. The ultimate outcome of these examinations cannot be predicted with certainty. Should the IRS or other tax authorities assess additional taxes as a result of
examinations, we may be required to record charges that would adversely affect our results of operations and financial condition.
Adverse tax laws or regulations could be enacted or existing laws could be applied to us or our customers,
which could increase our costs and adversely affect our business.
The application of federal, state, local and international tax laws to services provided electronically is evolving. New income, sales, use or
other tax laws, statutes, rules, regulations or ordinances could be enacted at any time, possibly with retroactive effect, and could be applied solely or disproportionately to services provided over
the internet. These enactments could adversely affect our sales activity due to the inherent cost increase the taxes would represent and ultimately result in a negative impact on our operating results
and cash flows.
In
addition, existing tax laws, statutes, rules, regulations or ordinances could be interpreted, changed, modified or applied adversely to us, possibly with retroactive effect, which
could require us or our customers to pay additional tax amounts, as well as require us or our customers to pay fines or penalties and interest for past amounts. If we are unsuccessful in collecting
such taxes from our customers, we could be held liable for such costs.
Certain
jurisdictions in which we do not collect sales and use, value added or similar taxes may assert that such taxes are applicable, which has resulted or could result in tax
assessments, penalties and interest, to us or our customers for past amounts, and we may be required to collect such taxes in the future. Such tax assessments, penalties and interest, or future
requirements may adversely affect our operating results and financial condition.
Our ability to use our net operating losses to offset future taxable income may be subject to certain
limitations.
As of January 31, 2017, we had gross U.S. federal and tax-effected state net operating loss carryforwards, or NOLs, of
$119.6 million and $5.2 million, respectively, due to prior period losses. In general, under Section 382 of the Internal Revenue Code of 1986, as amended, or the Code, a
corporation that undergoes an ownership change, which is generally defined as a greater than 50-percentage-point cumulative change by value in the equity ownership of certain stockholders over a
rolling three-year period, is subject to limitations on its ability to utilize its pre-change NOLs to offset post-change taxable income. Our existing NOLs may be subject to limitations arising from
previous ownership changes, and if we undergo an ownership change in connection with or after this offering, our ability to utilize NOLs could be further limited by Section 382 of the Code.
Future changes in our stock ownership, some of which may be outside of our control, could result in an ownership change under Section 382 of the Code. Furthermore, our ability to utilize NOLs
of companies that we may acquire in the future may be subject to limitations. There is also a risk that due to regulatory changes, such as suspensions on the use of NOLs, or other unforeseen reasons,
our existing NOLs could expire or otherwise be unavailable to offset future income tax liabilities. For these reasons, we may not be able to realize a tax benefit from the use of our NOLs, even if we
attain profitability.
31
Table of Contents
Our reported financial results may be adversely affected by changes in accounting principles generally
accepted in the United States.
Generally accepted accounting principles in the United States, or U.S. GAAP, are subject to interpretation by the Financial Accounting
Standards Board, or FASB, the SEC, and various bodies formed to promulgate and interpret appropriate accounting principles. A change in these
principles or interpretations could have a significant effect on our reported financial results and could affect the reporting of transactions completed before the announcement of a change.
In
particular, in May 2014, the FASB issued ASU No. 2014-09, Revenue from Contracts with Customers (Topic 606), which supersedes the revenue recognition requirements in ASC 605,
Revenue Recognition. The core principle of ASU 2014-09 is that an entity should recognize revenue to depict the transfer of promised goods or services to customers in an amount that reflects the
consideration to which the entity expects to be entitled in exchange for those goods or services. As an "emerging growth company" the JOBS Act allows us to delay adoption of new or revised accounting
pronouncements applicable to public companies until such pronouncements are made applicable to private companies. We have elected to use this extended transition period under the JOBS Act, including
with respect to ASU 2014-09. As a result, we will not be required to apply ASU 2014-09 until February 1, 2019.
The estimates of market opportunity and forecasts of market growth included in this prospectus may prove to
be inaccurate, and even if the market in which we compete achieves the forecasted growth, our business could fail to grow at similar rates, if at all.
Market opportunity estimates and growth forecasts included in this prospectus are subject to significant uncertainty and are based on
assumptions and estimates that may not prove to be accurate. Even if the market in which we compete meets the size estimates and growth forecasted in this prospectus, our business could fail to grow
at similar rates, if at all. For more information regarding the estimates of market opportunity and the forecasts of market growth included in this prospectus, see "Industry Data."
Our management team has limited experience managing a public company.
Our chief executive officer does not have experience managing a public company, interacting with public company investors and complying with the
increasingly complex laws pertaining to public companies. While our chief financial officer and certain other executives have such experience, our management team, as a whole, may not successfully or
efficiently manage the transition to being a public company subject to significant regulatory oversight and reporting obligations under the federal securities laws and the continuous scrutiny of
securities analysts and investors. These new obligations and constituents will require significant attention from our senior management, particularly from our chief executive officer, and could divert
their attention away from the day-to-day management of our business, which could adversely affect our business, operating results and financial condition.
We are subject to anti-corruption, anti-bribery, anti-money laundering and similar laws, and non-compliance
with such laws can subject us to criminal penalties or significant fines and harm our business and reputation.
We are subject to anti-corruption and anti-bribery and similar laws, such as the U.S. Foreign Corrupt Practices Act of 1977, as amended, or the
FCPA, the U.S. domestic bribery statute contained in 18 U.S.C. § 201, the U.S. Travel Act, the USA PATRIOT Act, the U.K. Bribery Act 2010, the Proceeds of Crime Act 2002 and
possibly other anti-corruption, anti-bribery and anti-money laundering laws in countries in which we conduct activities. Anti-corruption and anti-bribery laws have been enforced aggressively in recent
years and are interpreted broadly and prohibit companies and their employees and agents from promising, authorizing, making, offering, soliciting or accepting improper payments or other benefits to or
from government officials and others in the private sector. As we increase our international sales and business, particularly in countries with a low score on the Corruptions Perceptions Index by
Transparency International, and increase our use of third-party business partners such as sales agents, distributors,
32
Table of Contents
resellers,
or consultants, our risks under these laws may increase. We can be held liable for the corrupt or other illegal activities of our employees, representatives, contractors, business partners
and agents, even if we do not explicitly authorize or have actual knowledge of such activities. While we have policies and procedures in this area, we cannot guarantee that improprieties committed by
our employees or third parties will not occur. Noncompliance with these laws could subject us to investigations, sanctions, settlements, prosecution, other enforcement actions, disgorgement of
profits, significant fines, damages, other civil and criminal penalties or injunctions, suspension or debarment from contracting with certain persons, the loss of export privileges, whistleblower
complaints, reputational harm, adverse media coverage, and other collateral consequences. If any subpoenas or investigations are launched, or governmental or other sanctions are imposed, or if we do
not prevail in any possible civil or criminal litigation, our business, results of operations and financial condition could be materially harmed. In addition, responding to any action will likely
result in a materially significant diversion of management's attention and resources and significant defense and compliance costs and other professional fees. In certain cases, enforcement authorities
may even require us to appoint an independent compliance monitor, which can result in added costs and administrative burdens. Any investigations, actions or sanctions or other previously mentioned
harm could have a material negative effect on our business, operating results and financial condition.
We are subject to governmental export and import controls and economic sanctions laws that could impair our
ability to compete in international markets and subject us to liability if we are not in full compliance with applicable laws.
Our business activities are subject to various restrictions under U.S. export and import controls and trade and economic sanctions laws,
including U.S. customs regulations, the U.S. Commerce Department's Export Administration Regulations and economic and trade sanctions regulations maintained by the U.S. Treasury Department's Office of
Foreign Assets Control. The U.S. export control laws and U.S. economic sanctions laws include prohibitions on the sale or supply of certain products and services to U.S. embargoed or sanctioned
countries, governments, persons and entities and also require authorization for the export of certain encryption items. In addition, various countries regulate the import of certain encryption
technology, including through import permitting and licensing requirements, and have enacted laws that could limit our ability to distribute our services or could limit our customers' ability to
implement our services in those countries. Although we take precautions to prevent our platform from being provided in violation of such laws, our platform may have been in the past, and could in the
future be, provided inadvertently in violation of such laws, despite the precautions we take. If we fail to comply with these laws and regulations, we and certain of our employees could be subject to
civil or criminal penalties, including the possible loss of export or import privileges, monetary penalties, and, in extreme cases, imprisonment of responsible employees for knowing and willful
violations of these laws. Obtaining the necessary authorizations, including any required license, for a particular transaction may be time-consuming, is not guaranteed, and may result in the delay or
loss of sales opportunities. In addition, changes in our platform or changes in applicable export or import regulations may create delays in the introduction and sale of our products in international
markets, prevent our customers with international operations from deploying our products or, in some cases, prevent the export or import of our products to certain countries, governments or persons
altogether. Any change in export or import regulations, shift in the enforcement or scope of existing regulations, or change in the countries, governments, persons or technologies targeted by such
regulations, could also result in decreased use of our products or in our decreased ability to export or sell our products to existing or potential customers with international operations. Any
decreased use of our products or limitation on our ability to export or sell our products would likely adversely affect our business. Although we take precautions to prevent transactions with U.S.
sanction targets, we could inadvertently provide our platform to persons prohibited by U.S. sanctions. Violations of export and import regulations and economic sanctions could result in negative
consequences to us, including government investigations, penalties and reputational harm.
33
Table of Contents
Changes in laws and regulations related to the internet or changes in internet infrastructure itself may
diminish the demand for our platform and could adversely affect our business and results of operations.
The future success of our business depends upon the continued use of the internet. Federal, state or foreign government bodies or agencies have
in the past adopted, and may in the future adopt, laws or regulations affecting the use of the internet as a commercial medium. In addition, government agencies or private organizations have imposed
and may impose additional taxes, fees or other charges for accessing the internet, generally. These laws or charges could limit the use of the internet or decrease the demand for internet-based
solutions. In addition, the use of the internet as a business tool could be adversely affected due to delays in the development or adoption of new standards and protocols to handle increased demands
of internet activity, security, reliability, cost, ease-of-use, accessibility and quality of service. The performance of the internet and its acceptance as a business tool has been adversely affected
by "viruses", "worms" and similar malicious programs. If the use of the internet is reduced as a result of these or other issues, then demand for our platform could decline, which could adversely
affect our business, operating results and financial condition.
We are exposed to fluctuations in currency exchange rates.
We face exposure to movements in currency exchange rates, which may cause our revenue and operating results to differ materially from
expectations. Our operating results could be negatively affected depending on the amount of expense denominated in foreign currencies. As exchange rates vary, revenue, cost of revenue, operating
expenses and other operating results, when re-measured, may differ materially from expectations. In addition, our operating results are subject to fluctuation if our mix of U.S. and foreign currency
denominated transactions and expenses changes in the future. Although we may apply certain strategies to mitigate foreign currency risk, these strategies might not eliminate our exposure to foreign
exchange rate fluctuations and would involve costs and risks of their own, such as ongoing management time and expertise, external costs to implement the strategies and potential accounting
implications. Additionally, as we anticipate growing our business further outside of the United States, the effects of movements in currency exchange rates will increase as our transaction volume
outside of the United States increases.
Our credit facility contains restrictive covenants that may limit our operating flexibility.
Our credit facility contains restrictive covenants that limit our ability to transfer or dispose of assets, merge with other companies or
consummate certain changes of control, acquire other companies, open new offices that contain a material amount of assets, pay dividends, incur additional indebtedness and liens and enter into new
businesses. We therefore may not be able to engage in any of the foregoing transactions unless we obtain the consent of the lender or terminate the
credit facility, which may limit our operating flexibility. In addition, our credit facility is secured by all of our assets, other than our intellectual property, and requires us to satisfy certain
financial covenants. There is no guarantee that we will be able to generate sufficient cash flow or sales to meet these financial covenants or pay the principal and interest on any such debt.
Furthermore, there is no guarantee that future working capital, borrowings or equity financing will be available to repay or refinance any such debt. Any inability to make scheduled payments or meet
the financial covenants on our credit facility would adversely affect our business.
We may require additional capital to support our business, and this capital might not be available on
acceptable terms, if at all.
We intend to continue to make investments to support our business and may require additional funds. In particular, we may seek additional funds
to develop new features and enhance our existing features, expand our operations, including our sales and marketing organizations and our presence outside of the United States, improve our
infrastructure or acquire complementary businesses, technologies, services, features and other assets. Accordingly, we may need to engage in equity or debt financings to secure additional funds. If we
raise additional funds through future issuances of equity or convertible debt
34
Table of Contents
securities,
our stockholders could suffer significant dilution, and any new equity securities we issue could have rights, preferences and privileges superior to those of holders of our common stock.
Any debt financing that we may secure in the future could involve restrictive covenants relating to our capital raising activities and other financial and operational matters, which may make it more
difficult for us to obtain additional capital and to pursue business opportunities. We may not be able to obtain additional financing on terms favorable to us, if at all. If we are unable to obtain
adequate financing or financing on terms satisfactory to us when we require it, our ability to continue to support our business growth, scale our infrastructure, develop feature enhancements and to
respond to business challenges could be significantly impaired, and our business, operating results and financial condition may be adversely affected.
If the assumptions we use to estimate the size of our total addressable market are inaccurate, our future
growth may be affected.
We calculate the size of our estimated total addressable market based on the number of potential business locations and points of interest in
the world that we believe could benefit from our platform. We use data published by Google Maps as well as internally generated data and assumptions regarding our ability to generate revenue from
those locations. We have not independently verified the estimate of locations published by Google Maps and cannot assure you of its accuracy or completeness. In addition, our estimated market size is
based on estimated annual revenue per location of $100, which would be lower than the average revenue per location of $134, calculated using our total revenue of $124.3 million in fiscal year
2017 divided by our worldwide locations managed of 925,000 as of January 31, 2017. For the purposes of this calculation, we estimated a more conservative average revenue per location than our
historical average to account for the anticipated effects of entering new markets that may not generate the same revenue per location as our existing markets. For example, when we first enter a new
geographic market, we may initially provide discounts to customers to gain market traction. The amount and effect of these discounts may vary greatly by geography and size of market.
Our
estimate of our total addressable market does not include other opportunities, including but not limited to:
- •
- professional service providers located in multiple locations, such as individual doctors that provide services at multiple locations;
- •
- locations that have multiple service providers, such as several insurance agents that are located in the same office;
- •
- product information;
- •
- events that vary by location and schedule; and
- •
- review sources.
While
we believe the information on which we base our estimated market size is generally reliable, such information is inherently imprecise. In addition, our expectations, assumptions
and estimates of future opportunities are necessarily subject to a high degree of uncertainty and risk due to a variety of factors, including those described in this "Risk Factors" section of this
prospectus. If third-party or internally generated data prove to be inaccurate or we make errors in our assumptions based on that data, our future growth rate may be affected. In addition, these
inaccuracies or errors may cause us to misallocate capital and other business resources, all of which would harm our business, operating results and financial condition.
35
Table of Contents
Risks Related to this Offering, Ownership of Our Common Stock and Our Status as a Public Company
Our quarterly results may fluctuate significantly and may not fully reflect the underlying performance of our
business.
Our quarterly results of operations, including the levels of our revenues, gross margin and profitability, as well as our cash flows and
deferred revenue balances, may vary significantly in the future, and period-to-period comparisons of our operating results and key metrics may not be meaningful. Accordingly, the results of any one
quarter should not be relied upon as an indication of future performance. Although we have not historically experienced meaningful seasonality, our quarterly financial results and metrics may
fluctuate as a result of a variety of factors, many of which are outside of our control and, as a result, may not fully reflect the underlying performance of our business. These fluctuations may
negatively affect the value of our common stock. Factors that may cause fluctuations in our quarterly results include:
- •
- our ability to attract new customers;
- •
- our ability to execute on our business strategy;
- •
- the addition or loss of large customers, including resellers, including through acquisitions or consolidations;
- •
- the timing of recognition of revenues;
- •
- the amount and timing of operating expenses;
- •
- network outages and security breaches;
- •
- general economic, industry and market conditions;
- •
- customer renewal rates;
- •
- pricing changes upon any renewals of customer agreements;
- •
- changes in our pricing policies or those of our competitors;
- •
- the timing and success of new feature introductions by us or our competitors or any other change in the competitive dynamics of our industry,
including consolidation among competitors, customers or application providers;
- •
- the timing of expenses related to the development or acquisition of technologies or businesses and potential future charges for impairment of
goodwill from acquired companies; and
- •
- unforeseen litigation.
If securities or industry analysts do not initiate, publish or cease publishing research or reports about us,
our business or our market, or if they change their recommendations regarding our stock adversely, or if our actual results differ significantly from our guidance, our stock price and trading volume
could decline.
The trading market for our common stock will depend in part on the research and reports that securities or industry analysts publish about us or
our business. If few securities analysts commence coverage of us, or if industry analysts cease coverage of us, the trading price for our common stock would be negatively affected. If one or more of
the analysts who cover us downgrade our common stock or publish inaccurate or unfavorable research about our business, the price of our common stock would likely decline. If one or more of these
analysts cease coverage of us or fail to publish reports on us regularly, demand for our common stock could decrease, which might cause our common stock price and trading volume to decline.
36
Table of Contents
In
addition, from time to time, we may release earnings guidance or other forward-looking statements in our earnings releases, earnings conference calls or otherwise regarding our future
performance that represent our management's estimates as of the date of release. Some or all of the assumptions of any future guidance that we furnish may not materialize or may vary significantly
from actual future results. Any failure to meet guidance or analysts' expectations could have a material adverse effect on the trading price or trading volume of our common stock.
Our share price may be volatile, and you may be unable to sell your shares at or above the offering price, if
at all. Market volatility may affect the value of an investment in our common stock and could subject us to litigation.
Technology stocks have historically experienced high levels of volatility. There has been no public market for our common stock prior to this
offering. The initial public offering price for the shares of our common stock has been determined by negotiations between us and representatives of the underwriters and may vary from the market price
of our common stock following this offering. The market price of our common stock could be subject to wide fluctuations in response to many risk factors listed in this section, and others beyond our
control, including:
- •
- actual or anticipated fluctuations in our financial condition and operating results;
- •
- changes in projected operational and financial results;
- •
- addition or loss of significant customers;
- •
- changes in laws or regulations applicable to our platform;
- •
- actual or anticipated changes in our growth rate relative to our competitors;
- •
- announcements of technological innovations or new offerings by us or our competitors;
- •
- announcements by us or our competitors of significant acquisitions, strategic partnerships, joint ventures or capital-raising activities or
commitments;
- •
- additions or departures of key personnel;
- •
- changes in our financial guidance or securities analysts' estimates of our financial performance;
- •
- discussion of us or our stock price by the financial press and in online investor communities;
- •
- reaction to our press releases and filings with the SEC;
- •
- changes in accounting principles;
- •
- announcements related to litigation;
- •
- fluctuations in the valuation of companies perceived by investors to be comparable to us;
- •
- sales of our common stock by us or our stockholders;
- •
- share price and volume fluctuations attributable to inconsistent trading volume levels of our shares;
- •
- the expiration of any contractual lock-up periods; and
- •
- general economic and market conditions.
Furthermore,
in recent years, the stock markets have experienced extreme price and volume fluctuations that have affected and continue to affect the market prices of equity securities of
many companies, and technology companies in particular. These fluctuations often have been unrelated or disproportionate to the operating performance of those companies. These broad market and
industry fluctuations, as well as general economic, political and market conditions such as recessions, interest rate changes or international currency fluctuations, may negatively impact the market
price of our common stock. If the market price of our common stock after this offering does not exceed the initial
public offering price, you may not realize any return on your investment in us and may lose some or all of your investment.
37
Table of Contents
In
the past, companies that have experienced volatility in the market price of their stock have been subject to securities class action litigation. We may be the target of this type of litigation in
the future. Securities litigation against us could result in substantial costs and divert our management's attention from other business concerns, which could also harm our business.
There has been no prior market for our common stock and an active market may not develop or be sustained and
investors may not be able to resell their shares at or above the initial public offering price.
There has been no public market for our common stock prior to this offering. If you purchase shares of our common stock in this offering, you
may not be able to resell those shares at or above the initial public offering price, if at all. An active or liquid market in our common stock may not develop upon the closing of this offering or, if
it does develop, it may not be sustainable.
If you purchase shares of our common stock in this offering, you will experience substantial and immediate
dilution.
The public offering price of our common stock is substantially higher than the net tangible book value per share of our common stock. Therefore,
if you purchase shares of our common stock in this offering, you will pay a price per share that substantially exceeds our net tangible book value per share after this offering. Based on the initial
public offering price of $11.00 per share, after deducting underwriting discounts and commissions and estimated offering expenses payable by us, you will experience immediate dilution of $9.96 per
share, representing the difference between the initial public offering price and our pro forma as adjusted net tangible book value per share after giving effect to this offering.
Future sales and issuances of our capital stock or rights to purchase capital stock could result in
additional dilution of the percentage ownership of our stockholders and could cause our stock price to decline.
We may issue additional securities following the completion of this offering. Our certificate of incorporation to be in effect following this
offering will authorize us to issue up to 500,000,000 shares of common stock. Future sales and issuances of our capital stock or rights to purchase our capital stock could result in substantial
dilution to our existing stockholders. We may sell common stock, convertible securities and other equity securities in one or more transactions at prices and in a manner as we may determine from time
to time. If we sell any such securities in subsequent transactions, the ownership of existing stockholders will be diluted, possibly materially. New investors in subsequent transactions could also
gain rights, preferences and privileges senior to those of existing holders of our common stock.
We may invest or spend the proceeds of this offering in ways with which you may not agree or in ways which
may not yield a return.
The net proceeds from the sale of our shares of our common stock by us in this offering may be used for general corporate purposes, including
working capital, capital expenses and other general corporate purposes. We may also use a portion of the net proceeds to fund potential acquisitions, or investments in, technologies or businesses that
complement our business, although we have no present commitments or agreements to enter into any such acquisitions at this time. Our management will have considerable discretion in the application of
the net proceeds, and you will not have the opportunity, as part of your investment decision, to assess whether the proceeds are being used appropriately. Until the net proceeds are used, they may be
placed in investments that do not produce significant income or that may lose value.
We do not intend to pay dividends for the foreseeable future.
We may not declare or pay cash dividends on our capital stock in the near future. We currently intend to retain any future earnings to finance
the operation and expansion of our business, and we do not expect to declare or pay any dividends in the foreseeable future. Consequently, stockholders must rely on sales of their common stock after
price appreciation as the only way to realize any future gains on their investment.
38
Table of Contents
Substantial blocks of our total outstanding shares may be sold into the market when the lock-up period ends.
If there are substantial sales of shares of our common stock, or the market perception that such sales may occur, the price of our common stock could decline.
The price of our common stock could decline if there are substantial sales of our common stock, particularly sales by our directors, executive
officers and significant stockholders, or if there is a large number of shares of our common stock available for sale and the market perceives that sales will occur. After this offering, we will have
85,489,470 shares of our common stock outstanding, based on the number of shares outstanding as of January 31, 2017. All of the shares of common stock sold in this offering will be freely
tradeable without restrictions or further registration under the Securities Act of 1933, as amended, or the Securities Act, except for any shares held by our affiliates as defined in Rule 144
under the Securities Act. All shares held by our directors and officers and substantially all of our stockholders and holders of options and warrants, other than shares of common stock issued
in this offering, are currently restricted from resale as a result of a contractual "lock-up" restriction. These shares will become available to be sold 181 days after the date of this
prospectus, with earlier sales permitted at the discretion of the representatives of the underwriters. The lock-up restrictions are more fully described in the "Shares Eligible for Future Sale" and
"Underwriting" sections of this prospectus. Shares held by directors, executive officers and other affiliates will be subject to volume limitations under Rule 144 under the Securities Act.
In
addition, we intend to file one or more registration statements to register the shares of common stock subject to outstanding options under our equity incentive plans and the shares
reserved for future issuance under our equity incentive plans. Shares registered on these registration statements would be eligible for sale to the public, subject to certain legal and contractual
limitations. The market price of the shares of our common stock could decline as a result of the sale of a substantial number of our shares of common stock in the public market or the perception in
the market that the holders of a large number of shares intend to sell their shares.
Additionally,
after this offering, certain existing holders of our common stock and outstanding warrants, or their transferees, will have rights, subject to specified conditions, to
require us to file one or more registration statements covering their shares or to include their shares in registration statements that we may file for ourselves or other stockholders. If we were to
register the resale of these shares, they could be freely sold in the public market. If these additional shares are sold, or if it is perceived that they will be sold, in the public market, the
trading price of our common stock could be adversely affected.
The concentration of our stock ownership will likely limit your ability to influence corporate matters,
including the ability to influence the outcome of director elections and other matters requiring stockholder approval.
Following this offering, our executive officers, directors and the holders of more than 5% of our outstanding common stock in the aggregate will
beneficially own approximately 82% of our common stock, assuming no exercise by the underwriters of their over-allotment option, no exercise of outstanding options or warrants, and after giving effect
to the issuance of shares in this offering. As a result, these stockholders, acting together, will have significant influence over all matters that require approval by our stockholders, including the
election of directors and approval of significant corporate transactions. Corporate actions might be taken even if other stockholders, including those who purchase shares in this offering, oppose
them. This concentration of ownership might also have the effect of delaying or preventing a change of control of our company that other stockholders may view as beneficial.
Delaware law and provisions in our amended and restated certificate of incorporation and amended and restated
bylaws that will be in effect at the closing of this offering could make a merger, tender offer or proxy contest difficult, thereby depressing the trading price of our common stock.
Following the closing of this offering, our status as a Delaware corporation may discourage, delay or prevent a change in control, even if a
change of control would be beneficial to our existing stockholders. In
39
Table of Contents
addition,
our amended and restated certificate of incorporation and amended and restated bylaws that will be in effect at the closing of this offering will contain provisions that may make the
acquisition of our company more difficult, including the following:
- •
- a classified board of directors with three-year staggered terms, which could delay the ability of stockholders to change the membership of a
majority of our Board of Directors;
- •
- a prohibition on cumulative voting in the election of our directors;
- •
- the requirement that our directors may only be removed for cause;
- •
- the ability of our Board of Directors to issue shares of preferred stock and to determine the price and other terms of those shares, including
preferences and voting rights, without stockholder approval, which could be used to significantly dilute the ownership of a hostile acquirer;
- •
- the right of our Board of Directors to elect a director to fill a vacancy created by the expansion of our Board of Directors or the
resignation, death or removal of a director;
- •
- a prohibition on stockholder action by written consent, which forces stockholder action to be taken at an annual or special meeting of our
stockholders;
- •
- the requirement that a special meeting of stockholders may be called only by a majority vote of our entire Board of Directors, the chairman of
our Board of Directors or our chief executive officer, which could delay the ability of our stockholders to force consideration of a proposal or to take action, including the removal of directors;
- •
- the requirement for the affirmative vote of holders of at least 662/3% of the voting power of all of the
then-outstanding shares
of our voting stock, voting together as a single class, to amend the provisions of our amended and restated certificate of incorporation relating to the management of our business or our amended and
restated bylaws, which may inhibit the ability of an acquirer to effect such amendments to facilitate an unsolicited takeover attempt; and
- •
- advance notice procedures with which stockholders must comply to nominate candidates to our Board of Directors or to propose matters to be
acted upon at a stockholders' meeting, which may discourage or deter a potential acquirer from conducting a solicitation of proxies to elect the acquirer's own slate of directors or otherwise
attempting to obtain control of us.
In
addition, as a Delaware corporation, we are subject to Section 203 of the Delaware General Corporation Law. The provisions of Section 203 may prohibit large
stockholders, in particular those owning 15% or more of our outstanding voting stock, from merging or combining with us for three years after achieving that ownership threshold. A Delaware corporation
may opt out of this provision by express provision in its original certificate of incorporation or by amendment to its certificate of incorporation or bylaws approved by its stockholders. However, we
have not opted out of this provision.
These
and other provisions in our amended and restated certificate of incorporation, amended and restated bylaws and Delaware law could make it more difficult for stockholders or
potential acquirers to obtain control of our Board of Directors or initiate actions that are opposed by our then-current Board of Directors, including delaying or impeding a merger, tender offer, or
proxy contest involving our company. The existence of these provisions could negatively affect the price of our common stock and limit opportunities for you to realize value in a corporate
transaction.
For
additional information regarding these and other provisions, see "Description of Capital Stock."
We will incur significantly increased costs and devote substantial management time as a result of operating
as a public company.
As a public company, we will incur significant legal, accounting and other expenses that we did not incur as a private company. For example, we
will be subject to the reporting requirements of the Securities
40
Table of Contents
Exchange
Act of 1934, as amended, and will be required to comply with the applicable requirements of the Sarbanes-Oxley Act and the Dodd-Frank Wall Street Reform and Consumer Protection Act, as well
as rules and regulations subsequently implemented by the SEC and the New York Stock Exchange, including the establishment and maintenance of effective disclosure and financial controls and changes in
corporate governance practices. We expect that compliance with these requirements will increase our legal and financial compliance costs and will make some activities more time consuming and costly.
In addition, we expect that our management and other personnel will need to divert attention from operational and other business matters to devote substantial time to these public company
requirements. In particular, we expect to incur significant expenses and devote substantial management effort toward ensuring compliance with the requirements of Section 404 of the
Sarbanes-Oxley Act, which will increase when we are no longer an emerging growth company, as defined by the JOBS Act. We will need to hire additional accounting and financial staff with appropriate
public company experience and technical accounting knowledge and maintain an internal audit function. We cannot predict or estimate the amount of additional costs we may incur as a result of becoming
a public company or the timing of such costs.
We are an emerging growth company, and we cannot be certain if the reduced disclosure and governance
requirements applicable to emerging growth companies will make our common stock less attractive to investors.
For as long as we continue to be an emerging growth company, we intend to take advantage of certain exemptions from various reporting
requirements that are applicable to other public companies, including not being required to comply with the auditor attestation requirements of Section 404 of the Sarbanes-Oxley Act, reduced
disclosure obligations regarding executive compensation in our periodic reports and proxy statements and exemptions from the requirements of holding a nonbinding advisory vote on executive
compensation and stockholder approval of any golden parachute payments not previously approved. We cannot predict if investors will find our common stock less attractive because we will rely on these
exemptions. If some investors find our common stock less attractive as a result, there may be a less active trading market for our common stock and our stock price may be more volatile.
We
will remain an emerging growth company and may take advantage of these reporting exemptions until the earliest of (i) the end of the fiscal year in which the market value of
our common stock that is held by non-affiliates exceeds $700 million as of the preceding July 31, which is the end of our second fiscal quarter, (ii) the end of the fiscal year in
which we have total annual gross revenues of $1 billion or more during such fiscal year, (iii) the date on which we issue more than $1 billion in non-convertible debt in a
three-year period or (iv) the end of the fiscal year that is five years from the date of this prospectus.
We are an emerging growth company, and we have elected to use the extended transition period for complying
with new or revised accounting standards otherwise applicable to public companies, which may make our common stock less attractive to investors.
As an emerging growth company, the JOBS Act allows us to delay adoption of new or revised accounting pronouncements applicable to public
companies until such pronouncements are made applicable to private companies. We have elected to use this extended transition period under the JOBS Act. As a result, our consolidated financial
statements may not be comparable to the financial statements of issuers who are required to comply with the effective dates for new or revised accounting standards that are applicable to public
companies, which may make our common stock less attractive to investors.
41
Table of Contents
CAUTIONARY NOTE REGARDING FORWARD-LOOKING STATEMENTS
This prospectus contains forward-looking statements. These statements may relate to, but are not limited to, expectations of future operating
results or financial performance, capital expenditures, use of proceeds from this offering, introduction of new products and enhancements to our current platform, regulatory compliance, plans for
growth and future operations, the size of our
addressable market and market trends, as well as assumptions relating to the foregoing. Forward-looking statements are inherently subject to risks and uncertainties, some of which cannot be predicted
or quantified. These risks and other factors include, but are not limited to, those listed under "Risk Factors." In some cases, you can identify forward-looking statements by terminology such as
"may," "will," "should," "could," "expect," "plan," "anticipate," "believe," "estimate," "predict," "intend," "potential," "might," "would," "continue" or the negative of these terms or other
comparable terminology. Actual events or results may differ from those expressed in these forward-looking statements, and these differences may be material and adverse. The forward-looking statements
are contained principally in "Prospectus Summary," "Risk Factors," "Management's Discussion and Analysis of Financial Condition and Result of Operations" and "Business."
We
have based the forward-looking statements contained in this prospectus primarily on our current expectations and projections about future events and trends that we believe may affect
our business, financial condition, results of operations, prospects, business strategy and financial needs. The outcome of the events described in these forward-looking statements is subject to risks,
uncertainties, assumptions and other factors described in the section captioned "Risk Factors" and elsewhere in this prospectus. These risks are not exhaustive. Other sections of this prospectus
include additional factors that could adversely affect our business and financial performance. Moreover, we operate in a very competitive and rapidly changing environment. New risks and uncertainties
emerge from time to time and it is not possible for us to predict all risks and uncertainties that could have an impact on the forward-looking statements contained in this prospectus. We cannot assure
you that the results, events and circumstances reflected in the forward-looking statements will be achieved or occur, and actual results, events or circumstances could differ materially from those
described in the forward-looking statements.
In
addition, statements that "we believe" and similar statements reflect our beliefs and opinions on the relevant subject. These statements are based upon information available to us as
of the date of this prospectus, and while we believe such information forms a reasonable basis for such statements, such information may be limited or incomplete, and our statements should not
be read to indicate that we have conducted an exhaustive inquiry into, or review of, all potentially available relevant information. These statements are inherently uncertain and investors are
cautioned not to unduly rely upon these statements.
You
should read this prospectus and the documents that we reference in this prospectus and have filed as exhibits to the registration statement of which this prospectus forms a
part with the understanding that our actual future results, levels of activity, performance and achievements may be materially different from what we expect. We qualify all of our forward-looking
statements by these cautionary statements.
The
forward-looking statements made in this prospectus relate only to events as of the date on which such statements are made. We undertake no obligation to update any forward-looking
statements after the date of this prospectus or to conform such statements to actual results or revised expectations, except as required by law.
42
Table of Contents
INDUSTRY DATA
This prospectus contains estimates and other information concerning our industry, including market size and growth rates of the markets in which
we participate, that are based on industry publications, surveys and forecasts, including those generated by Google, the U.S. Census Bureau and BIA/Kelsey. This information involves a number of
assumptions and limitations, and you are cautioned not to give undue weight to these estimates. The industry in which we operate is subject to a high degree of uncertainty and risk due to a variety of
factors, including those described in "Risk Factors." These and other factors could cause actual results to differ from those expressed in these publications, surveys and forecasts.
43
Table of Contents
USE OF PROCEEDS
We estimate that the net proceeds from our sale of 10,500,000 shares of common stock in this offering will be approximately
$103.0 million, or $119.1 million if the underwriters exercise their over-allotment option in full, at the initial public offering price of $11.00 per share, after deducting underwriting
discounts and commissions and estimated offering expenses payable by us.
The
principal purposes of this offering are to create a public market for our common stock and to facilitate our future access to the public equity markets, as well as to obtain
additional capital.
Except
as discussed below, we currently have no specific plans for the use of a significant portion of the net proceeds of this offering. However, we anticipate that we will use the net
proceeds from this
offering for working capital, capital expenditures and other general corporate expenses. We may also use a portion of our net proceeds to fund potential acquisitions, or investments in, technologies
or businesses that complement our business, although we have no present commitments or agreements to enter into any such acquisitions or make any such investments. The timing and amount of our actual
expenditures will be based on many factors, including cash flows from operations and the anticipated growth of our business. Pending these uses, we intend to invest the net proceeds of this offering
primarily in short-term, investment-grade, interest-bearing instruments.
DIVIDEND POLICY
We have never declared or paid any dividends on our capital stock. We anticipate that we will retain any earnings to support operations and to
finance the growth and development of our business. Accordingly, we do not expect to pay cash dividends on our common stock in the foreseeable future. In addition, our revolving credit facility
agreement contains customary covenants restricting our ability to pay dividends.
44
Table of Contents
CAPITALIZATION
The following table sets forth our cash and cash equivalents and capitalization as of January 31,
2017:
- •
- on an actual basis;
- •
- on a pro forma basis to give effect to (i) the conversion of all then outstanding shares of our convertible preferred stock into an
aggregate of 43,594,753 shares of our common stock, which will occur automatically upon the closing of this offering; and (ii) the automatic conversion of outstanding warrants exercisable for
shares of our convertible preferred stock into warrants exercisable for 110,937 shares of our common stock immediately prior to the completion of this offering and the reclassification of the related
warrant liability to additional paid-in-capital; and
- •
- on a pro forma as adjusted basis to give further effect to (i) our sale of 10,500,000 shares of common stock in this offering and our
receipt of the net proceeds therefrom at the initial public offering price of $11.00 per share, after deducting underwriting discounts and commissions and estimated offering expenses payable by us;
and (ii) the filing and effectiveness of our amended and restated certificate of incorporation in Delaware, which will occur immediately prior to the completion of this offering.
You
should read this table in conjunction with "Management's Discussion and Analysis of Financial Condition and Results of Operations" and our consolidated financial statements and
related notes included elsewhere in this prospectus.
|
|
|
|
|
|
|
|
|
|
|
|
|
As of January 31, 2017 |
|
|
|
Actual |
|
Pro Forma |
|
Pro Forma
As Adjusted |
|
|
|
(in thousands,
except share and per share amounts)
|
|
Cash and cash equivalents |
|
$ |
24,420 |
|
$ |
24,420 |
|
$ |
127,605 |
|
|
|
|
|
|
|
|
|
|
|
|
|
|
|
|
|
|
|
|
|
|
|
|
|
|
|
|
|
|
|
|
|
|
|
|
|
Preferred stock warrant liability |
|
$ |
944 |
|
$ |
— |
|
$ |
— |
|
Long term debt |
|
|
5,000 |
|
|
5,000 |
|
|
5,000 |
|
Convertible preferred stock, $0.001 par value per share; 43,705,690 shares authorized actual and pro forma; 43,594,753
shares issued and outstanding, actual; no shares authorized, pro forma as adjusted; no shares issued or outstanding, pro forma and pro forma as adjusted |
|
|
120,615 |
|
|
— |
|
|
— |
|
Stockholders' (deficit) equity: |
|
|
|
|
|
|
|
|
|
|
Preferred stock, $0.001 par value per share; no shares authorized, issued or outstanding, actual and pro forma;
50,000,000 shares authorized, no shares issued or outstanding, pro forma as adjusted |
|
|
— |
|
|
— |
|
|
— |
|
Common stock, $0.001 par value per share; 200,000,000 shares authorized, actual and pro forma; 500,000,000 shares
authorized, pro forma as adjusted; 37,900,051 shares issued, actual; 81,494,804 shares issued, pro forma; 91,994,804 shares issued, pro forma as adjusted; 31,394,717 shares outstanding, actual; 74,989,470 shares outstanding, pro forma;
85,489,470 shares outstanding, pro forma as adjusted |
|
|
38 |
|
|
82 |
|
|
92 |
|
Additional paid-in capital |
|
|
52,805 |
|
|
174,320 |
|
|
277,325 |
|
Accumulated other comprehensive loss |
|
|
(1,808 |
) |
|
(1,808 |
) |
|
(1,808 |
) |
Accumulated deficit |
|
|
(166,885 |
) |
|
(166,885 |
) |
|
(166,885 |
) |
Treasury stock, at cost |
|
|
(11,905 |
) |
|
(11,905 |
) |
|
(11,905 |
) |
|
|
|
|
|
|
|
|
|
|
|
|
Total stockholders' (deficit) equity |
|
|
(127,755 |
) |
|
(6,196 |
) |
|
96,819 |
|
|
|
|
|
|
|
|
|
|
|
|
|
Total capitalization |
|
$ |
(1,196 |
) |
$ |
(1,196 |
) |
$ |
101,819 |
|
|
|
|
|
|
|
|
|
|
|
|
|
|
|
|
|
|
|
|
|
|
|
|
|
|
|
|
|
|
|
|
|
|
|
|
|
45
Table of Contents
The
preceding data is based on the number of shares of our common stock outstanding as of January 31, 2017. This number excludes:
- •
- 27,420,108 shares of common stock issuable upon exercise of options that were outstanding as of January 31, 2017 at a weighted-average
exercise price of $4.24 per share;
- •
- 330,000 shares of common stock issuable upon the vesting and settlement of restricted stock units that were outstanding as of
January 31, 2017;
- •
- 195,937 shares of common stock issuable upon exercise of warrants that were outstanding as of January 31, 2017 at a weighted-average
exercise price of $1.65 per share;
- •
- 799,250 shares of common stock issuable upon the exercise of options granted after January 31, 2017 at a weighted-average exercise price
of $8.64 per share;
- •
- 6,913,791 shares of common stock reserved for future issuance under our 2016 Equity Incentive Plan, which became effective in December 2016
(after giving effect to the shares of our common stock issuable upon the exercise of options to purchase 799,250 shares of common stock granted after January 31, 2017), plus any shares returned
to our 2008 Equity Incentive Plan as the result of expiration or termination of options or other awards; and
- •
- 1,500,000 shares of common stock reserved for future issuance under our 2017 Employee Stock Purchase Plan.
46
Table of Contents
DILUTION
If you invest in our common stock, your interest will be diluted to the extent of the difference between the initial public offering price per
share of our common stock and the pro forma as adjusted net tangible book value per share of our common stock after this offering. Our pro forma net tangible book value as of January 31, 2017
was $(13.8) million, or $(0.18) per share of common stock. Pro forma net tangible book value per share represents total tangible assets less total
liabilities, divided by the number of shares of common stock outstanding, assuming (i) the conversion of all then outstanding shares of our convertible preferred stock into an aggregate of
43,594,753 shares of our common stock, which will occur automatically upon the closing of this offering; and (ii) the automatic conversion of outstanding warrants exercisable for shares of our
convertible preferred stock into warrants exercisable for 110,937 shares of our common stock immediately prior to the completion of this offering and the reclassification of the related warrant
liability to additional paid-in-capital. After giving effect to the sale by us of 10,500,000 shares of our common stock in this offering at the initial public offering price of $11.00 per share, after
deducting underwriting discounts and commissions and estimated offering expenses payable by us, our pro forma as adjusted net tangible book value as of January 31, 2017 would have been
$89.2 million, or $1.04 per share. This represents an immediate increase in pro forma net tangible book value of $1.22 per share to our existing stockholders and an immediate dilution of $9.96
per share to our new investors purchasing shares of common stock in this offering. The following table illustrates this dilution on a per share basis:
|
|
|
|
|
|
|
|
Initial public offering price per share |
|
|
|
|
$ |
11.00 |
|
Pro forma net tangible book value per share as of January 31, 2017 |
|
$ |
(0.18 |
) |
|
|
|
Increase in pro forma net tangible book value per share attributable to this
offering |
|
|
1.22 |
|
|
|
|
|
|
|
|
|
|
|
|
|
Pro forma as adjusted net tangible book value per share after this offering |
|
|
|
|
|
1.04 |
|
|
|
|
|
|
|
|
|
|
Dilution per share to new investors |
|
|
|
|
$ |
9.96 |
|
|
|
|
|
|
|
|
|
|
|
|
|
|
|
|
|
|
|
|
|
|
|
|
|
|
|
|
If
the underwriters exercise their over-allotment option in full, the pro forma as adjusted net tangible book value per share after the offering would be $1.21 per share, the increase in
the pro forma net
tangible book value per share to existing stockholders would be $1.39 per share and the dilution to new investors purchasing common stock in this offering would be $9.79 per share.
The
following table illustrates, on the pro forma as adjusted basis described in the preceding paragraphs as of January 31, 2017, the differences between the number of shares of
common stock purchased from us, the total consideration paid, and the average price per share paid by existing stockholders and new investors purchasing shares of our common stock in this offering at
the initial public offering price of $11.00 per share, before deducting underwriting discounts and commissions and estimated offering expenses payable by us.
|
|
|
|
|
|
|
|
|
|
|
|
|
|
|
|
|
|
|
|
|
|
|
Total
Consideration |
|
|
|
|
|
Shares Purchased |
|
|
|
|
|
Average Price
Per Share |
|
|
|
Number |
|
Percent |
|
Dollars |
|
Percent |
|
Existing Investors |
|
|
74,989,470 |
|
|
88 |
% |
$ |
162,497,000 |
|
|
58 |
% |
$ |
2.17 |
|
New Investors |
|
|
10,500,000 |
|
|
12 |
|
|
115,500,000 |
|
|
42 |
|
|
11.00 |
|
|
|
|
|
|
|
|
|
|
|
|
|
|
|
|
|
|
|
Total |
|
|
85,489,470 |
|
|
100 |
% |
$ |
277,997,000 |
|
|
100 |
% |
|
|
|
|
|
|
|
|
|
|
|
|
|
|
|
|
|
|
|
|
|
|
|
|
|
|
|
|
|
|
|
|
|
|
|
|
|
|
|
|
|
|
|
|
|
|
|
|
|
|
|
|
|
|
|
|
|
If
the underwriters exercise their over-allotment option in full, the percentage of shares of common stock held by existing stockholders will decrease to 86% of the total number of
shares of our common stock
47
Table of Contents
outstanding
after this offering, and the number of shares held by new investors will be increased to 12,075,000, or 14% of the total number of shares of our common stock outstanding after this
offering.
The
data in the preceding table and paragraphs exclude, as of January 31, 2017:
- •
- 27,420,108 shares of common stock issuable upon exercise of options that were outstanding as of January 31, 2017 at a weighted-average
exercise price of $4.24 per share;
- •
- 330,000 shares of common stock issuable upon the vesting and settlement of restricted stock units that were outstanding as of
January 31, 2017;
- •
- 195,937 shares of common stock issuable upon exercise of warrants that were outstanding as of January 31, 2017 at a weighted-average
exercise price of $1.65 per share;
- •
- 799,250 shares of common stock issuable upon the exercise of options granted after January 31, 2017 at a weighted-average exercise price
of $8.64 per share;
- •
- 6,913,791 shares of common stock reserved for future issuance under our 2016 Equity Incentive Plan, which became effective in December 2016
(after giving effect to the shares of our common stock issuable upon the exercise of options to purchase 799,250 shares of common stock granted after January 31, 2017), plus the shares returned
to our 2008 Equity Incentive Plan as the result of expiration or termination of options or other awards; and
- •
- 1,500,000 shares of common stock reserved for future issuance under our 2017 Employee Stock Purchase Plan.
The
shares of our common stock reserved for future issuance under our 2016 Equity Incentive Plan will be subject to automatic annual increases in accordance with the terms of the Plan.
To the extent that options or warrants are exercised, new options are issued under our 2016 Equity Incentive Plan, or we issue additional shares of common stock in the future, there will be further
dilution to investors participating in this offering. In addition, we may choose to raise additional capital because of market conditions or strategic considerations, even if we believe that we have
sufficient funds for our current or future operating plans. If we raise additional capital through the sale of equity or convertible debt securities, the issuance of these securities could result in
further dilution to our stockholders.
48
Table of Contents
SELECTED CONSOLIDATED FINANCIAL DATA
The following selected consolidated financial data should be read in conjunction with "Management's Discussion and Analysis of Financial
Condition and Results of Operations" and the consolidated financial statements and related notes included within this prospectus. Our fiscal year ends on January 31. References to fiscal year
2017, for example, refer to the fiscal year ended January 31, 2017.
The
consolidated statement of operations data for the fiscal years ended January 31, 2015, 2016 and 2017, and the consolidated balance sheet data as of January 31, 2016 and
2017, are derived from our audited consolidated financial statements and related notes included elsewhere in this prospectus.
Our
historical results are not necessarily indicative of our future results. The selected consolidated financial data in this section are not intended to replace our consolidated
financial statements and the related notes and are qualified in their entirety by the consolidated financial statements and related notes included elsewhere in this prospectus.
49
Table of Contents
|
|
|
|
|
|
|
|
|
|
|
|
|
Fiscal year ended January 31, |
|
|
|
2015 |
|
2016 |
|
2017 |
|
|
|
(in thousands, except share and per share data)
|
|
Consolidated Statement of Operations Data: |
|
|
|
|
|
|
|
|
|
|
Revenues |
|
$ |
60,002 |
|
$ |
89,724 |
|
$ |
124,261 |
|
Cost of revenues(1) |
|
|
24,832 |
|
|
31,033 |
|
|
36,950 |
|
|
|
|
|
|
|
|
|
|
|
|
|
Gross profit |
|
|
35,170 |
|
|
58,691 |
|
|
87,311 |
|
Operating expenses: |
|
|
|
|
|
|
|
|
|
|
Sales and marketing(1) |
|
|
31,588 |
|
|
49,822 |
|
|
81,529 |
|
Research and development(1) |
|
|
11,945 |
|
|
16,201 |
|
|
19,316 |
|
General and administrative(1) |
|
|
8,988 |
|
|
18,806 |
|
|
29,166 |
|
|
|
|
|
|
|
|
|
|
|
|
|
Total operating expenses |
|
|
52,521 |
|
|
84,829 |
|
|
130,011 |
|
|
|
|
|
|
|
|
|
|
|
|
|
Loss from operations |
|
|
(17,351 |
) |
|
(26,138 |
) |
|
(42,700 |
) |
Other income (expense), net |
|
|
78 |
|
|
(412 |
) |
|
(382 |
) |
|
|
|
|
|
|
|
|
|
|
|
|
Loss from operations before income taxes |
|
|
(17,273 |
) |
|
(26,550 |
) |
|
(43,082 |
) |
Benefit from (provision for) income taxes |
|
|
— |
|
|
55 |
|
|
(68 |
) |
|
|
|
|
|
|
|
|
|
|
|
|
Net loss |
|
$ |
(17,273 |
) |
$ |
(26,495 |
) |
$ |
(43,150 |
) |
|
|
|
|
|
|
|
|
|
|
|
|
|
|
|
|
|
|
|
|
|
|
|
|
|
|
|
|
|
|
|
|
|
|
|
|
Net loss per share attributable to common stockholders, basic and diluted(2) |
|
$ |
(0.61 |
) |
$ |
(0.89 |
) |
$ |
(1.39 |
) |
|
|
|
|
|
|
|
|
|
|
|
|
|
|
|
|
|
|
|
|
|
|
|
|
|
|
|
|
|
|
|
|
|
|
|
|
Weighted-average number of shares used in computing net loss per share attributable to common stockholders, basic and
diluted(2) |
|
|
28,519,917 |
|
|
29,917,814 |
|
|
31,069,695 |
|
|
|
|
|
|
|
|
|
|
|
|
|
|
|
|
|
|
|
|
|
|
|
|
|
|
|
|
|
|
|
|
|
|
|
|
|
Pro forma net loss per share attributable to common stockholders, basic and diluted (unaudited)(2) |
|
|
|
|
|
|
|
$ |
(0.58 |
) |
|
|
|
|
|
|
|
|
|
|
|
|
|
|
|
|
|
|
|
|
|
|
|
|
|
|
|
|
|
|
|
|
|
|
|
|
Weighted-average number of shares used in computing pro forma net loss per share attributable to common stockholders,
basic and diluted (unaudited)(2) |
|
|
|
|
|
|
|
|
74,664,448 |
|
|
|
|
|
|
|
|
|
|
|
|
|
|
|
|
|
|
|
|
|
|
|
|
|
|
|
|
|
|
|
|
|
|
|
|
|
- (1)
- Includes
stock-based compensation expense as follows:
|
|
|
|
|
|
|
|
|
|
|
|
|
Fiscal year ended
January 31, |
|
|
|
2015 |
|
2016 |
|
2017 |
|
|
|
(in thousands)
|
|
Cost of revenues |
|
$ |
399 |
|
$ |
533 |
|
$ |
590 |
|
Sales and marketing |
|
|
920 |
|
|
1,559 |
|
|
4,359 |
|
Research and development |
|
|
1,104 |
|
|
1,300 |
|
|
1,954 |
|
General and administrative |
|
|
480 |
|
|
1,115 |
|
|
2,948 |
|
|
|
|
|
|
|
|
|
|
|
|
|
Total stock-based compensation |
|
$ |
2,903 |
|
$ |
4,507 |
|
$ |
9,851 |
|
|
|
|
|
|
|
|
|
|
|
|
|
|
|
|
|
|
|
|
|
|
|
|
|
|
|
|
|
|
|
|
|
|
|
|
|
- (2)
- See
Note 12, "Net Loss Per Share Attributable to Common Stockholders and Unaudited Pro Forma Net Loss Per Share," to our consolidated financial statements
included elsewhere in this prospectus for an explanation of the method used to calculate basic, diluted and pro forma net loss per common share attributable to common stockholders.
50
Table of Contents
|
|
|
|
|
|
|
|
|
|
January 31, |
|
|
|
2016 |
|
2017 |
|
|
|
(in thousands)
|
|
Consolidated Balance Sheet Data: |
|
|
|
|
|
|
|
Cash and cash equivalents |
|
$ |
30,028 |
|
$ |
24,420 |
|
Total current assets |
|
|
58,156 |
|
|
61,829 |
|
Total assets |
|
|
85,497 |
|
|
86,465 |
|
Current deferred revenue |
|
|
35,954 |
|
|
57,112 |
|
Total liabilities |
|
|
60,118 |
|
|
93,605 |
|
Convertible preferred stock |
|
|
120,615 |
|
|
120,615 |
|
Total stockholders' deficit |
|
|
(95,236 |
) |
|
(127,755 |
) |
Non-GAAP Net Loss
In addition to our financial results determined in accordance with GAAP, we believe that non-GAAP net loss is useful in evaluating our operating
performance. We regularly review non-GAAP net loss as we evaluate our business.
|
|
|
|
|
|
|
|
|
|
|
|
|
Fiscal year ended January 31, |
|
|
|
2015 |
|
2016 |
|
2017 |
|
|
|
(in thousands)
|
|
Non-GAAP net loss |
|
$ |
(14,370 |
) |
$ |
(21,988 |
) |
$ |
(33,299 |
) |
Non-GAAP
net loss is a financial measure that is not calculated in accordance with GAAP. We define non-GAAP net loss as our GAAP net loss as adjusted to exclude the effects of
stock-based compensation expenses. We believe non-GAAP net loss provides investors and other users of our financial information consistency and comparability with our past financial performance and
facilitates period-to-period comparisons of our results of operations. We also believe non-GAAP net loss is useful in evaluating our operating performance compared to that of other companies in our
industry, as this metric eliminates the effects of stock-based compensation, which may vary for reasons unrelated to overall operating performance.
We
use non-GAAP net loss in conjunction with traditional GAAP measures as part of our overall assessment of our performance, including the preparation of our annual operating budget and
quarterly forecasts, to evaluate the effectiveness of our business strategies and to communicate with our Board of Directors concerning our financial performance. Our definition may differ from the
definitions used by other companies and therefore comparability may be limited. In addition, other companies may not publish this or similar metrics. Thus, our non-GAAP net loss should be considered
in addition to, not as a substitute for, nor superior to or in isolation from, measures prepared in accordance with GAAP.
Non-GAAP
net loss may be limited in its usefulness because it does not present the full economic effect of our use of stock-based compensation. We compensate for these limitations by
providing investors and other users of our financial information a reconciliation of non-GAAP net loss to net loss, the most closely related GAAP financial measure. We encourage investors and others
to review our financial information in its entirety, not to rely on any single financial measure and to view non-GAAP net loss in conjunction with net loss.
The
following table provides a reconciliation of net loss to non-GAAP net loss:
|
|
|
|
|
|
|
|
|
|
|
|
|
Fiscal year ended January 31, |
|
|
|
2015 |
|
2016 |
|
2017 |
|
|
|
(in thousands)
|
|
Net loss |
|
$ |
(17,273 |
) |
$ |
(26,495 |
) |
$ |
(43,150 |
) |
Stock-based compensation |
|
|
2,903 |
|
|
4,507 |
|
|
9,851 |
|
|
|
|
|
|
|
|
|
|
|
|
|
Non-GAAP net loss |
|
$ |
(14,370 |
) |
$ |
(21,988 |
) |
$ |
(33,299 |
) |
|
|
|
|
|
|
|
|
|
|
|
|
|
|
|
|
|
|
|
|
|
|
|
|
|
|
|
|
|
|
|
|
|
|
|
|
51
Table of Contents
MANAGEMENT'S DISCUSSION AND ANALYSIS OF FINANCIAL CONDITION
AND RESULTS OF OPERATIONS
The following discussion and analysis of our financial condition and results of operations should be read in conjunction
with our consolidated financial statements and the related notes to those statements included elsewhere in this prospectus. In addition to historical financial information, the
following discussion and analysis contains forward-looking statements that involve risks, uncertainties and assumptions. Our actual results and timing of selected events may differ materially from
those anticipated in these forward-looking statements as a result of many factors, including those discussed under "Risk Factors" and elsewhere in this prospectus. See "Cautionary Note Regarding
Forward-Looking Statements."
Our fiscal year ends on January 31. References to fiscal year 2017, for example, refer to the fiscal year ended January 31,
2017.
Overview
Yext is a knowledge engine. Our platform lets businesses manage their digital knowledge in the cloud and sync it to over 100 services including
Apple Maps, Bing, Cortana, Facebook, Google, Google Maps, Instagram, Siri and Yelp. We have established direct data integrations between our software and the members of our PowerListings Network,
which consumers around the globe use to discover new businesses, read reviews and find accurate answers to their queries.
Our
cloud-based software platform, the Yext Knowledge Engine, powers all of our key features including our Listings, Pages and Reviews features along with our other features and
capabilities. We offer annual and multi-year subscriptions to our platform. We had historically priced our subscriptions based on custom combinations of the features that the customer wished to access
and the number of locations that the customer managed with our platform. Beginning in October 2015, we began pricing new subscriptions in a more discrete range of packages, with pricing based on
specified feature sets and the number of locations managed by the customer with our platform.
We
sell our solution globally to customers of all sizes, from one location to thousands of locations, through direct sales efforts to our customers, including third-party resellers, and
through a self-service purchase process. Our direct sales force has grown to 106 full-time employees as of January 31, 2017. Most of our resellers serve small business customers or non-U.S.
customers, while we serve the significant majority of enterprise and mid-size business customers through our direct sales force. In transactions with resellers, we are only party to the transaction
with the reseller and are not a party to the reseller's transaction with its customer.
Although
our business has predominantly focused on the U.S. market, we have been growing internationally in recent years. We offer the same services internationally as we do in the
United States, and we intend to continue to pursue a strategy of expanding our international operations. Our revenues from non-U.S operations have grown from an immaterial amount of our total revenues
in fiscal year 2015 to more than 6% of total revenues in fiscal year 2017. Our non-U.S. revenues are defined as revenues derived from contracts that are originally entered into with our non-U.S.
offices, regardless of the location of the customer. We generally direct non-U.S. customer sales to our non-U.S. offices.
Our
business has evolved in recent years. For example:
- •
- in 2014, we added our Pages feature to our platform, raised $50 million from investors to expand our business, began our operations in
the United Kingdom and accelerated our operations in continental Europe;
52
Table of Contents
- •
- in 2015, we continued to expand our PowerListings Network to include over 100 global applications;
and
- •
- in 2016, we launched specialized integrations to our platform with applications like Uber and Snapchat, added our new Reviews feature to our
platform and held our inaugural LocationWorld industry and customer event in New York City.
We
have experienced rapid growth in recent periods, nearly all of which has been organic growth as we have not historically conducted many acquisitions. Evidencing our strengthening
market position in recent years, we have grown the number of locations listed in our Knowledge Engine platform from approximately 345,000 as of January 31, 2015 to over 925,000 as of
January 31, 2017. For our fiscal years ended January 31, 2015, 2016 and 2017, our revenues were $60.0 million, $89.7 million and $124.3 million, respectively, our
net loss was $17.3 million, $26.5 million and $43.2 million, respectively, and our non-GAAP net loss was $14.4 million, $22.0 million and $33.3 million,
respectively.
Key Factors Affecting Our Performance
We believe that our future performance will depend on many factors, including the following:
Adding New Customers. Growth of our customer base is important to our continued revenue growth.
We believe that we are positioned to grow
significantly. There are currently over 100 million potential business locations and points of interest in the world as identified by Google Maps, and we believe this is the potential market
that could benefit from some or all of the features of our platform. The number of locations managed by our customers on our platform has grown from approximately 345,000 as of January 31, 2015
to over 925,000 as of January 31, 2017. We believe that we have a substantial opportunity to expand our number of customers in the coming years.
Market Adoption of Cloud-Based Digital Knowledge Software. A key focus of our sales and
marketing efforts is creating market awareness about the
benefits of our Knowledge Engine platform. The market for digital knowledge management software is largely undeveloped, and potential customers may not yet fully appreciate the potential benefit of
the flexibility and power of our platform. As digital knowledge becomes increasingly critical, including as customers need to manage more locations or as their digital knowledge evolves to include
more complex and dynamic data, such as events, people and products, we believe that the need for digital knowledge management solutions will increase and our customer use opportunities will
correspondingly expand.
Retention of and Expansion within Our Existing Customer Base. Our pricing strategy generally
varies based on the number of locations managed by a
customer and the level of service and features that a customer requires. Until October 2015, we generally offered various customized levels of access to some or all of our features in our platform on
a subscription basis with pricing based on the number of locations and features used. In October 2015, we changed our pricing model for new subscriptions to offer a multi-tiered approach that starts
with basic access to the Knowledge Engine and successively includes access to additional packages of key features as summarized as follows. We categorize our current packages as Base,
53
Table of Contents
Starter,
Professional and Ultimate. Each package can then include or exclude our Pages feature. The current features of the packages are as follows:
Packages Without Pages
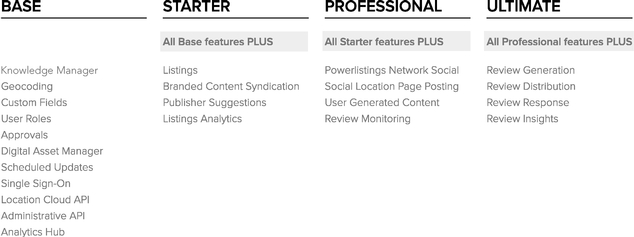
Packages With Pages
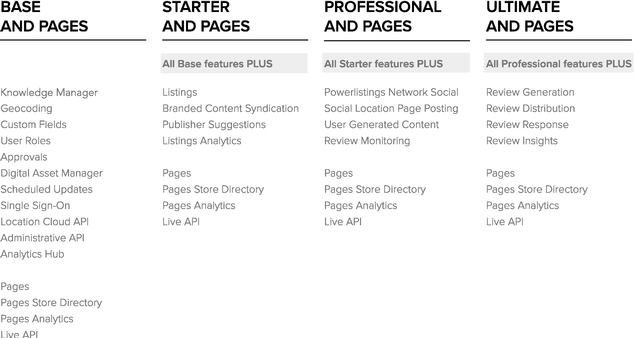
Many
of our customers initially deploy a Starter or Professional subscription to control and manage their digital knowledge using the Listings feature. Some customers start with the Base
subscription if
they only need internal location management. As customers realize the benefits of our platform, many have increased or expanded their existing subscription levels to obtain greater access to our key
features, such as Reviews and Pages, as they need them.
We
believe that our ability to retain our customers and expand the revenue they generate for us over time is an important component of our growth strategy and reflects the long-term
value of our customer relationships. We assess our performance in this respect using a metric we refer to as our dollar-based net retention rate. Our dollar-based net retention rate was 113%, 121%,
and 119% for fiscal years 2015, 2016
54
Table of Contents
and
2017, respectively. We calculate this metric for a particular period by first establishing a cohort of the enterprise, mid-size and reseller customers who had active contracts at the end of each
month of the same period in the prior year. We divide the single month revenue from each of those customer cohorts for the applicable month in the current year by the single month revenue of that same
customer cohort for the corresponding month in the prior year. We then determine the dollar-based weighted average of each of the monthly rates, and this average represents the dollar-based net
retention rate for the period. We only consider revenue from enterprise and mid-size customers and reseller customers when calculating this metric since small businesses that have limited locations
experience inherently high turnover. Our revenue from direct sales to small businesses represented less than 20% of our total revenue in the fiscal years ended January 31, 2016 and 2017, and we
expect it to decline further as a percentage of total revenues as our other channels increase, although not in absolute dollars.
We
have experienced significant revenue growth by attracting new customers and growing their annual spend with us over time through increased subscription levels and new product
offerings. The chart below shows the total revenue from each cohort over the periods presented. Each cohort represents the period in which revenue was first recognized from a customer making their
initial purchase. For example, the fiscal year 2015 cohort represents revenue recognized from customers whose initial subscription commenced between February 1, 2014 and January 31,
2015. The fiscal year 2015 cohort increased their revenue from $9.2 million in fiscal year 2015 to $24.0 million in fiscal year 2017, growing by 161% over that two-year period. We only
consider revenue from enterprise and mid-size customers and reseller customers in this analysis since small businesses have limited locations and inherently high turnover.
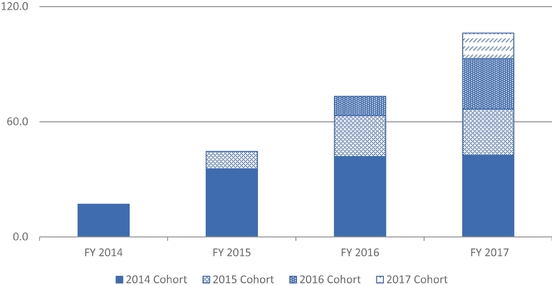
We
believe that we will be able to generate additional revenue as our customers increase their subscription levels and as we introduce new products into the marketplace.
Investment in Growth. We plan to continue to invest in our business so that we can capitalize on
our market opportunity and focus on long-term
growth. We believe that our market opportunity is large and mostly untapped, and we will continue to invest significantly in sales and marketing to acquire new customers and to increase sales to
existing customers. We also intend to increase our sales and marketing efforts on certain specific industry verticals such as healthcare and financial services, where a specialized approach may be
beneficial, and to pursue new verticals. We have increased our sales and marketing headcount from 98 as of February 1, 2014 to 372 as of January 31, 2017, and we expect to continue to
increase our sales and marketing headcount in the future. Along with growing our direct sales force, we are continuing to develop and expand our network of resellers including professional marketers,
digital agencies, search engine optimization providers, web developers and social media managers to supplement our direct sales resources and increase our reach in our target markets. We also intend
to continue to grow our research and development team to extend the range of our Knowledge Engine platform to bring
55
Table of Contents
additional
products and features to our customer base. However, we expect our sales and marketing expenses and research and development expenses as a percentage of revenues to decrease over time as we
grow our revenues and gain economies of scale by increasing our customer base and increasing sales to our existing customer base. We believe that these investments will contribute to our long-term
growth, although they may compromise our ability to achieve and maintain profitability in the near term. To support our expected growth and our transition to being a public company, we plan to invest
in other operational and administrative functions. We expect to use the proceeds from this offering to fund these growth strategies. We do not expect to be profitable in the near future.
Components of Our Operating Results
Revenues
We derive our revenues primarily from subscription services. We sell subscriptions to our cloud platform through contracts that are typically
one year in length, but may be up to three years or longer in length. Revenues are a function of the number of customers, the number of locations at each customer, the edition, or for older contracts,
number of features, to which each customer subscribes, the price of the edition or the feature set and renewal rates. Revenues are recognized ratably over the contract term beginning on the
commencement date of each contract, at which time the customers are granted access to the platform, the appropriate edition or feature set and associated support. We typically invoice our customers in
annual installments at the beginning of each year in the subscription period. Amounts that have been invoiced are initially recorded as deferred revenue and are recognized ratably over the
subscription period.
Cost of Revenues
Cost of revenues includes fees we pay for our PowerListings Network application integrations. Our arrangements with PowerListings Network
providers follow one of three mechanisms, unpaid, fixed fee or variable fee based on locations served or revenues. The arrangements with many of our larger providers are unpaid. As the value of our
customers' digital knowledge increases over time to our PowerListings Network providers, we expect that we will be able to negotiate lower or no fees and, therefore, that our provider fees as a
percentage of total revenues will generally decline. Cost of revenues also includes expenses related to hosting our service and providing support services. These expenses are primarily comprised of
personnel and related costs directly associated with our cloud infrastructure and customer support, including salaries, benefits, stock-based compensation, data center capacity costs and other
allocated overhead costs.
Operating Expenses
Sales and marketing expenses. Sales and marketing expenses are our largest cost and consist primarily
of salaries and related expenses, including
stock-based compensation and commissions, as well as costs related to advertising, marketing, brand awareness activities and lead generation.
Research and development expenses. Research and development expenses consist primarily of salaries and
related expenses, including stock-based
compensation, upfront costs to integrate new PowerListings Network applications with our platform and costs to develop new products and features.
General and administrative expenses. General and administrative expenses consist of salaries and
related expenses, including stock-based
compensation, for our finance and accounting, human resources, information technology and legal support departments, as well as professional and consulting fees in connection with these departments.
Other income (expense), net
Other income (expense), net consists primarily of the change in the fair value of outstanding warrants, interest expense and interest income.
The fair value of our preferred stock warrant liability is re-measured at the end of each reporting period and any changes in fair value are recognized in other income or expense. Upon completion of
this offering, the preferred stock warrants will automatically, in accordance
56
Table of Contents
with
their terms, become warrants to purchase common stock, which will result in the reclassification of the preferred stock warrant liability to additional paid-in capital, and no further changes in
fair value will be recognized in other income or expense for these warrants.
Benefit from (provision for) income taxes
Benefit from (provision for) income taxes consists primarily of income taxes related to foreign jurisdictions in which we conduct business. For
further information, see Note 10 of our consolidated financial statements included elsewhere in this prospectus.
Results of Operations
The following table sets forth selected consolidated statement of operations data and such data expressed as a percentage of revenues for each
of the periods indicated.
|
|
|
|
|
|
|
|
|
|
|
|
|
Fiscal year ended
January 31, |
|
|
|
2015 |
|
2016 |
|
2017 |
|
|
|
(in thousands)
|
|
Revenues |
|
$ |
60,002 |
|
$ |
89,724 |
|
$ |
124,261 |
|
Cost of revenues(1) |
|
|
24,832 |
|
|
31,033 |
|
|
36,950 |
|
|
|
|
|
|
|
|
|
|
|
|
|
Gross profit |
|
|
35,170 |
|
|
58,691 |
|
|
87,311 |
|
Operating expenses: |
|
|
|
|
|
|
|
|
|
|
Sales and marketing(1) |
|
|
31,588 |
|
|
49,822 |
|
|
81,529 |
|
Research and development(1) |
|
|
11,945 |
|
|
16,201 |
|
|
19,316 |
|
General and administrative(1) |
|
|
8,988 |
|
|
18,806 |
|
|
29,166 |
|
|
|
|
|
|
|
|
|
|
|
|
|
Total operating expenses |
|
|
52,521 |
|
|
84,829 |
|
|
130,011 |
|
|
|
|
|
|
|
|
|
|
|
|
|
Loss from operations |
|
|
(17,351 |
) |
|
(26,138 |
) |
|
(42,700 |
) |
Other income (expense), net |
|
|
78 |
|
|
(412 |
) |
|
(382 |
) |
|
|
|
|
|
|
|
|
|
|
|
|
Loss from operations before income taxes |
|
|
(17,273 |
) |
|
(26,550 |
) |
|
(43,082 |
) |
Benefit from (provision for) income taxes |
|
|
0 |
|
|
55 |
|
|
(68 |
) |
|
|
|
|
|
|
|
|
|
|
|
|
Net loss |
|
$ |
(17,273 |
) |
$ |
(26,495 |
) |
$ |
(43,150 |
) |
|
|
|
|
|
|
|
|
|
|
|
|
|
|
|
|
|
|
|
|
|
|
|
|
|
|
|
|
|
|
|
|
|
|
|
|
- (1)
- Includes
stock-based compensation expense as follows:
|
|
|
|
|
|
|
|
|
|
|
|
|
Fiscal year ended
January 31, |
|
|
|
2015 |
|
2016 |
|
2017 |
|
|
|
(in thousands)
|
|
Cost of revenues |
|
$ |
399 |
|
$ |
533 |
|
$ |
590 |
|
Sales and marketing |
|
|
920 |
|
|
1,559 |
|
|
4,359 |
|
Research and development |
|
|
1,104 |
|
|
1,300 |
|
|
1,954 |
|
General and administrative |
|
|
480 |
|
|
1,115 |
|
|
2,948 |
|
|
|
|
|
|
|
|
|
|
|
|
|
Total stock-based compensation |
|
$ |
2,903 |
|
$ |
4,507 |
|
$ |
9,851 |
|
|
|
|
|
|
|
|
|
|
|
|
|
|
|
|
|
|
|
|
|
|
|
|
|
|
|
|
|
|
|
|
|
|
|
|
|
57
Table of Contents
|
|
|
|
|
|
|
|
|
|
|
|
|
Fiscal year ended
January 31, |
|
|
|
2015 |
|
2016 |
|
2017 |
|
Revenues |
|
|
100 |
% |
|
100 |
% |
|
100 |
% |
Cost of revenues |
|
|
41 |
|
|
35 |
|
|
30 |
|
|
|
|
|
|
|
|
|
|
|
|
|
Gross margin |
|
|
59 |
|
|
65 |
|
|
70 |
|
Operating expenses: |
|
|
|
|
|
|
|
|
|
|
Sales and marketing |
|
|
53 |
|
|
56 |
|
|
66 |
|
Research and development |
|
|
20 |
|
|
18 |
|
|
16 |
|
General and administrative |
|
|
15 |
|
|
21 |
|
|
23 |
|
|
|
|
|
|
|
|
|
|
|
|
|
Total operating expenses |
|
|
88 |
|
|
95 |
|
|
105 |
|
|
|
|
|
|
|
|
|
|
|
|
|
Loss from operations |
|
|
(29 |
) |
|
(29 |
) |
|
(35 |
) |
Other income (expense), net |
|
|
0 |
|
|
(1 |
) |
|
0 |
|
|
|
|
|
|
|
|
|
|
|
|
|
Loss from operations before income taxes |
|
|
(29 |
) |
|
(30 |
) |
|
(35 |
) |
Benefit from (provision for) income taxes |
|
|
0 |
|
|
0 |
|
|
0 |
|
|
|
|
|
|
|
|
|
|
|
|
|
Net loss |
|
|
(29 |
)% |
|
(30 |
)% |
|
(35 |
)% |
|
|
|
|
|
|
|
|
|
|
|
|
|
|
|
|
|
|
|
|
|
|
|
|
|
|
|
|
|
|
|
|
|
|
|
|
Fiscal Year Ended January 31, 2016 Compared to Fiscal Year Ended January 31, 2017
|
|
|
|
|
|
|
|
|
|
|
|
|
|
|
|
Fiscal year ended
January 31, |
|
Variance |
|
|
|
2016 |
|
2017 |
|
Dollars |
|
Percent |
|
|
|
(dollars in thousands)
|
|
Revenues |
|
$ |
89,724 |
|
$ |
124,261 |
|
$ |
34,537 |
|
|
38 |
% |
Cost of revenues |
|
|
31,033 |
|
|
36,950 |
|
|
5,917 |
|
|
19 |
|
Gross margin |
|
|
65 |
% |
|
70 |
% |
|
|
|
|
|
|
Revenues
increased primarily due to the continued growth of our customer base and expanded subscriptions sold to existing customers. Approximately $13.2 million of this increase
was attributable to new customers during the period. Growth was even greater for revenue from our enterprise and mid-size business and reseller customers, which represent the substantial majority of
our revenue, and not including direct sales to small business customers, which by their nature have limited locations and experience inherently high turnover. Our revenue from those enterprise and
mid-size customers grew by 46% from $73.1 million to $106.6 million.
Cost
of revenues increased primarily due to an increase in PowerListings Network application provider fees of $2.8 million, which grew from $16.3 million to
$19.1 million, as some of our PowerListings Network application provider costs are variable and increase with increased sales volume. Of the increase in provider costs in fiscal year 2017,
$1.9 million was attributable to increases in variable costs from certain PowerListings Network provider arrangements that required us to pay increased fees based on the number of active
locations on our platform or as a percentage of our revenues. In addition, personnel-related costs, which mainly consisted of salaries and wages, increased $1.6 million from $8.9 million
to $10.5 million, driven by increased headcount. Gross margin improved from 65% to 70%, as revenue growth outpaced the increase in cost of revenues.
|
|
|
|
|
|
|
|
|
|
|
|
|
|
|
|
Fiscal year ended
January 31, |
|
Variance |
|
|
|
2016 |
|
2017 |
|
Dollars |
|
Percent |
|
|
|
(dollars in thousands)
|
|
Sales and marketing |
|
$ |
49,822 |
|
$ |
81,529 |
|
$ |
31,707 |
|
|
64 |
% |
Research and development |
|
|
16,201 |
|
|
19,316 |
|
|
3,115 |
|
|
19 |
|
General and administrative |
|
|
18,806 |
|
|
29,166 |
|
|
10,360 |
|
|
55 |
|
58
Table of Contents
The increase in sales and marketing expenses was primarily driven by personnel-related costs, which increased $21.4 million, from $27.3 million to
$48.7 million, and consisted mainly of salaries and wages, commissions and bonuses. The increase in personnel-related costs was primarily due to an increased headcount, which grew from 249 to
372 employees in the sales and marketing function year over year, as we continued to expand our sales force to invest in our overall growth. Stock-based compensation expense increased
$2.8 million from $1.6 million to $4.4 million, due to a combination of additional share-based awards to new hires and the increasing valuation of our underlying common stock. In
addition, in November 2016, we held our inaugural LocationWorld industry and customer event, which accounted for $1.6 million in sales and marketing expense.
Research
and development expenses increased primarily due to increases in personnel-related costs, which increased $2.8 million due to increased headcount and consisted mainly of
salaries and wages. Stock-based compensation increased $0.7 million, from $1.3 million to $2.0 million, due to a combination of additional share-based awards to new hires and the
increasing valuation of our underlying common stock. The overall increase reflects our continued investment in our overall growth.
General
and administrative expenses increased primarily due to increases in personnel-related costs, which increased $4.8 million and consisted mainly of salaries and wages, in
line with our increase in headcount, which grew from 55 to 82 employees in general and administrative functions year over year. Recruiting and professional fees increased $1.4 million from
$6.5 million to $7.9 million to support our overall growth and scale our operations. Stock-based compensation increased $1.8 million, from $1.1 million to
$2.9 million, due to a combination of additional share-based awards to new hires and the increasing valuation of our underlying common stock.
Fiscal Year Ended January 31, 2015 Compared to Fiscal Year Ended January 31, 2016
|
|
|
|
|
|
|
|
|
|
|
|
|
|
|
|
Fiscal year ended
January 31, |
|
Variance |
|
|
|
2015 |
|
2016 |
|
Dollars |
|
Percent |
|
|
|
(dollars in thousands)
|
|
Revenues |
|
$ |
60,002 |
|
$ |
89,724 |
|
$ |
29,722 |
|
|
50 |
% |
Cost of revenues |
|
|
24,832 |
|
|
31,033 |
|
|
6,201 |
|
|
25 |
|
Gross margin |
|
|
59 |
% |
|
65 |
% |
|
|
|
|
|
|
Revenues
increased primarily due to the continued growth of our customer base and expanded subscriptions sold to existing customers. Approximately $10.0 million of this increase
was attributable to new customers during the period. Growth was even greater for revenue from our enterprise and mid-size business and reseller customers, which represent the substantial majority of
our revenue, and not including direct sales to small business customers, which by their nature have limited locations and experience inherently high turnover. Our revenue from those enterprise and
mid-size customers grew by 63% from $44.8 million to $73.1 million.
Cost
of revenues increased primarily due to an increase in PowerListings Network application provider fees of $4.9 million, which grew from $11.4 million to
$16.3 million, as some of our PowerListings Network application provider costs are variable and increase with increased sales volume. Of the increase in provider costs in fiscal year 2016,
$1.2 million was attributable to increases in variable costs from certain PowerListings Network provider arrangements that required us to pay increased fees based on the number of active
locations on our platform or as a percentage of our revenues. In addition, personnel-related costs increased $1.4 million from $7.5 million to $8.9 million and consisted mainly of
salaries and wages, driven by increased headcount. Gross margin improved from 59% to 65%, as revenue growth outpaced the increase in cost of revenues.
59
Table of Contents
|
|
|
|
|
|
|
|
|
|
|
|
|
|
|
|
Fiscal year ended
January 31, |
|
Variance |
|
|
|
2015 |
|
2016 |
|
Dollars |
|
Percent |
|
|
|
(dollars in thousands)
|
|
Sales and marketing |
|
$ |
31,588 |
|
$ |
49,822 |
|
$ |
18,234 |
|
|
58 |
% |
Research and development |
|
|
11,945 |
|
|
16,201 |
|
|
4,256 |
|
|
36 |
% |
General and administrative |
|
|
8,988 |
|
|
18,806 |
|
|
9,818 |
|
|
109 |
% |
The
increase in sales and marketing expenses was primarily driven by personnel-related costs, which increased $11.5 million, from $15.8 million to $27.3 million, and
consisted mainly of salaries and wages, commissions and bonuses. The increase in personnel-related costs was primarily due to an increased headcount, which grew from 185 to 249 employees in the sales
and marketing function year over year, as we continued to expand our sales force to invest in our overall growth. Stock-based compensation expense increased from $0.9 million to
$1.6 million due to a combination of additional share-based awards to new hires and the increasing valuation of our underlying common stock.
Research
and development expenses increased primarily due to increases in personnel-related costs, which increased $2.4 million and consisted mainly of salaries and wages.
Stock-based compensation increased from $1.1 million to $1.3 million due to a combination of additional share-based awards to new hires and the increasing valuation of our underlying
common stock. The overall increase reflects our continued investment in our overall growth.
General
and administrative expenses increased primarily due to professional fees, which increased $4.2 million from $2.3 million to $6.5 million and were primarily
driven by costs incurred to scale the business and accommodate international growth. Personnel-related costs increased $2.4 million from $3.3 million to $5.7 million and consisted
mainly of salaries and wages, in line with our increase in headcount, which grew from 35 to 55 general and administrative employees year over year. Stock-based compensation increased
$0.6 million, from $0.5 million to $1.1 million, due to a combination of additional share-based awards to new hires and the increasing valuation of our underlying common stock.
Quarterly Results of Operations
The following tables set forth selected unaudited quarterly consolidated statement of operations data for each of the eight quarters through the
quarter ended January 31, 2017, as well as the percentage of revenues that each line item represents for each quarter. The information for each of these quarters has been prepared on the same
basis as the audited annual consolidated financial statements included elsewhere in this prospectus and, in the opinion of management, includes all adjustments, which consist only of normal recurring
adjustments, necessary for the fair presentation of the results of operations for these periods in accordance with GAAP. This data should be read in conjunction with our audited consolidated financial
statements and related notes included elsewhere in this prospectus. These quarterly operating results are not necessarily indicative of our operating results for a full year or any future period.
60
Table of Contents
|
|
|
|
|
|
|
|
|
|
|
|
|
|
|
|
|
|
|
|
|
|
|
|
|
|
|
|
Quarter ended |
|
|
|
April 30,
2015 |
|
July 31,
2015 |
|
October 31,
2015 |
|
January 31,
2016 |
|
April 30,
2016 |
|
July 31,
2016 |
|
October 31,
2016 |
|
January 31,
2017 |
|
|
|
(in thousands)
|
|
Revenues |
|
$ |
18,930 |
|
$ |
21,707 |
|
$ |
23,403 |
|
$ |
25,684 |
|
$ |
27,125 |
|
$ |
29,556 |
|
$ |
31,909 |
|
$ |
35,671 |
|
Cost of revenues |
|
|
6,592 |
|
|
7,435 |
|
|
8,145 |
|
|
8,861 |
|
|
8,835 |
|
|
9,067 |
|
|
9,324 |
|
|
9,724 |
|
|
|
|
|
|
|
|
|
|
|
|
|
|
|
|
|
|
|
|
|
|
|
|
|
|
|
|
Gross profit |
|
|
12,338 |
|
|
14,272 |
|
|
15,258 |
|
|
16,823 |
|
|
18,290 |
|
|
20,489 |
|
|
22,585 |
|
|
25,947 |
|
Operating expenses: |
|
|
|
|
|
|
|
|
|
|
|
|
|
|
|
|
|
|
|
|
|
|
|
|
|
Sales and marketing |
|
|
10,699 |
|
|
11,382 |
|
|
13,294 |
|
|
14,447 |
|
|
16,843 |
|
|
18,132 |
|
|
20,393 |
|
|
26,161 |
|
Research and development |
|
|
3,457 |
|
|
3,958 |
|
|
4,218 |
|
|
4,568 |
|
|
4,771 |
|
|
4,673 |
|
|
4,764 |
|
|
5,108 |
|
General and administrative |
|
|
3,604 |
|
|
4,526 |
|
|
4,618 |
|
|
6,058 |
|
|
5,983 |
|
|
6,691 |
|
|
7,548 |
|
|
8,944 |
|
|
|
|
|
|
|
|
|
|
|
|
|
|
|
|
|
|
|
|
|
|
|
|
|
|
|
|
Total operating expenses |
|
|
17,760 |
|
|
19,866 |
|
|
22,130 |
|
|
25,073 |
|
|
27,597 |
|
|
29,496 |
|
|
32,705 |
|
|
40,213 |
|
|
|
|
|
|
|
|
|
|
|
|
|
|
|
|
|
|
|
|
|
|
|
|
|
|
|
|
Loss from operations |
|
|
(5,422 |
) |
|
(5,594 |
) |
|
(6,872 |
) |
|
(8,250 |
) |
|
(9,307 |
) |
|
(9,007 |
) |
|
(10,120 |
) |
|
(14,266 |
) |
Other expense |
|
|
(94 |
) |
|
(129 |
) |
|
(167 |
) |
|
(22 |
) |
|
(35 |
) |
|
(5 |
) |
|
(99 |
) |
|
(243 |
) |
|
|
|
|
|
|
|
|
|
|
|
|
|
|
|
|
|
|
|
|
|
|
|
|
|
|
|
Loss from operations before income taxes |
|
|
(5,516 |
) |
|
(5,723 |
) |
|
(7,039 |
) |
|
(8,272 |
) |
|
(9,342 |
) |
|
(9,012 |
) |
|
(10,219 |
) |
|
(14,509 |
) |
Benefit from (provision for) income taxes |
|
|
66 |
|
|
41 |
|
|
(61 |
) |
|
9 |
|
|
(1 |
) |
|
— |
|
|
(3 |
) |
|
(64 |
) |
|
|
|
|
|
|
|
|
|
|
|
|
|
|
|
|
|
|
|
|
|
|
|
|
|
|
|
Net loss |
|
$ |
(5,450 |
) |
$ |
(5,682 |
) |
$ |
(7,100 |
) |
$ |
(8,263 |
) |
$ |
(9,343 |
) |
$ |
(9,012 |
) |
$ |
(10,222 |
) |
$ |
(14,573 |
) |
|
|
|
|
|
|
|
|
|
|
|
|
|
|
|
|
|
|
|
|
|
|
|
|
|
|
|
|
|
|
|
|
|
|
|
|
|
|
|
|
|
|
|
|
|
|
|
|
|
|
|
|
|
|
|
|
|
|
|
|
|
|
|
|
|
|
|
|
|
|
|
|
|
|
|
|
|
|
|
|
|
|
|
|
|
|
|
|
|
|
|
|
|
|
|
|
|
|
|
|
|
|
|
|
|
|
|
|
|
Quarter ended |
|
|
|
April 30,
2015 |
|
July 31,
2015 |
|
October 31,
2015 |
|
January 31,
2016 |
|
April 30,
2016 |
|
July 31,
2016 |
|
October 31,
2016 |
|
January 31,
2017 |
|
Revenues |
|
|
100 |
% |
|
100 |
% |
|
100 |
% |
|
100 |
% |
|
100 |
% |
|
100 |
% |
|
100 |
% |
|
100 |
% |
Cost of revenues |
|
|
35 |
|
|
34 |
|
|
35 |
|
|
35 |
|
|
33 |
|
|
31 |
|
|
29 |
|
|
27 |
|
|
|
|
|
|
|
|
|
|
|
|
|
|
|
|
|
|
|
|
|
|
|
|
|
|
|
|
Gross margin |
|
|
65 |
|
|
66 |
|
|
65 |
|
|
65 |
|
|
67 |
|
|
69 |
|
|
71 |
|
|
73 |
|
Operating expenses: |
|
|
|
|
|
|
|
|
|
|
|
|
|
|
|
|
|
|
|
|
|
|
|
|
|
Sales and marketing |
|
|
57 |
|
|
52 |
|
|
57 |
|
|
56 |
|
|
62 |
|
|
61 |
|
|
64 |
|
|
73 |
|
Research and development |
|
|
18 |
|
|
18 |
|
|
18 |
|
|
18 |
|
|
18 |
|
|
16 |
|
|
15 |
|
|
15 |
|
General and administrative |
|
|
19 |
|
|
21 |
|
|
20 |
|
|
24 |
|
|
22 |
|
|
23 |
|
|
24 |
|
|
25 |
|
|
|
|
|
|
|
|
|
|
|
|
|
|
|
|
|
|
|
|
|
|
|
|
|
|
|
|
Total operating expenses |
|
|
94 |
|
|
92 |
|
|
95 |
|
|
98 |
|
|
102 |
|
|
100 |
|
|
102 |
|
|
113 |
|
|
|
|
|
|
|
|
|
|
|
|
|
|
|
|
|
|
|
|
|
|
|
|
|
|
|
|
Loss from operations |
|
|
(29 |
) |
|
(26 |
) |
|
(29 |
) |
|
(32 |
) |
|
(34 |
) |
|
(30 |
) |
|
(32 |
) |
|
(40 |
) |
Other expense |
|
|
(0 |
) |
|
(1 |
) |
|
(1 |
) |
|
(0 |
) |
|
(0 |
) |
|
(0 |
) |
|
(0 |
) |
|
(1 |
) |
|
|
|
|
|
|
|
|
|
|
|
|
|
|
|
|
|
|
|
|
|
|
|
|
|
|
|
Loss from operations before income taxes |
|
|
(29 |
) |
|
(26 |
) |
|
(30 |
) |
|
(32 |
) |
|
(34 |
) |
|
(30 |
) |
|
(32 |
) |
|
(41 |
) |
Benefit from (provision for) income taxes |
|
|
0 |
|
|
0 |
|
|
(0 |
) |
|
0 |
|
|
(0 |
) |
|
— |
|
|
(0 |
) |
|
0 |
|
|
|
|
|
|
|
|
|
|
|
|
|
|
|
|
|
|
|
|
|
|
|
|
|
|
|
|
Net loss |
|
|
(29 |
)% |
|
(26 |
)% |
|
(30 |
)% |
|
(32 |
)% |
|
(34 |
)% |
|
(30 |
)% |
|
(32 |
)% |
|
(41 |
)% |
|
|
|
|
|
|
|
|
|
|
|
|
|
|
|
|
|
|
|
|
|
|
|
|
|
|
|
|
|
|
|
|
|
|
|
|
|
|
|
|
|
|
|
|
|
|
|
|
|
|
|
|
|
|
|
|
|
|
|
|
|
|
|
|
|
|
|
|
|
|
|
|
|
|
|
|
|
|
|
|
|
61
Table of Contents
Our quarterly revenues have increased sequentially for all periods presented, primarily due to an increasing number of customers. We expect both
upselling to our existing customer
base and new customer acquisitions to continue to be significant drivers of revenue growth. We have not historically experienced meaningful seasonality in our revenue, although the rate of our recent
growth and the nature of our subscription agreements would likely have the effect of mitigating the effects of any potential seasonality in those periods.
Total
costs and expenses increased sequentially for all periods presented, primarily due to increased salary and related costs coinciding with an increase in the number of employees
required to run our growing business.
Gross
margin has generally improved as we have increased our revenues faster than our PowerListings Network application provider costs and other costs of revenues have increased. In the
long term, we expect gross margin to continue to increase as our PowerListings Network application provider costs decline as our data set becomes more important to those providers such that we are
able to negotiate more favorable terms with them. However, in the short to medium term, our gross margin may decrease as we enter new international markets in which we have yet to achieve efficiencies
of scale or introduce new features and products.
Sales
and marketing expenses grew sequentially over the periods primarily due to an expanding sales and marketing team and related expenses. In the fourth quarter of fiscal year 2017, we
held our inaugural LocationWorld industry and customer event. While generally growing, research and development expenses have declined slightly as a percentage of revenues as our revenues have grown
more rapidly. General and administrative expenses have generally grown due to increased costs required to support a growing business and will continue to increase as we prepare to be a public company
as evidenced by the increased expenses in fiscal year 2017 as we prepared for this offering.
Our
quarterly results may fluctuate due to various factors affecting our performance. Because we recognize revenues from subscription and support fees ratably over the term of the
contract, changes in our contracting activity in the near term may not be apparent as a change to our reported revenues until future periods. Most of our expenses are recorded as period costs and thus
factors affecting our cost structure may be reflected in our financial results sooner than changes to our revenues.
Liquidity and Capital Resources
Since our inception, we have financed our operations primarily through sales of convertible preferred stock and recently from drawing on our
revolving credit line. Between our inception in 2006 and January 31, 2017, we generated proceeds of $120.6 million from the sale of convertible preferred stock, net of issuance costs. At
January 31, 2017, we had cash and cash equivalents totaling $24.4 million, which were held for working capital purposes. Our cash equivalents are comprised primarily of bank deposits and
money market funds.
We
believe our existing cash and cash flow from operations, together with the proceeds from this offering and our undrawn balance under our credit facility will be sufficient to meet our
working capital requirements for at least the next 12 months. Our future capital requirements and the adequacy of available funds will depend on many factors, including those set forth under
"Risk Factors."
Credit Facility
On March 16, 2016, we entered into a loan and security agreement with Silicon Valley Bank that provides for a $15.0 million
revolving credit line and an additional $7.0 million in letters of credit. The facility with Silicon Valley Bank matures on March 16, 2018. We are obligated to pay ongoing commitment
fees at a rate equal to 0.25% for the revolving line and 1.75% for any issued letters of credit. Subject to certain terms of the loan agreement, we may borrow, prepay and reborrow amounts under the
revolving
62
Table of Contents
line
at any time during the agreement. Interest rates on borrowings under the revolving line will be based on 0.50% above the prime rate (with such prime rate as set forth in the money rates section
of The Wall Street Journal). The loan and security agreement and letters of credit contain customary affirmative and negative covenants, including an adjusted quick ratio financial covenant, a minimum
revenue financial covenant, a limit on our ability to incur additional indebtedness, dispose of assets, merge with or acquire other companies, pay dividends or distributions, and certain other
restrictions on our activities. On November 18, 2016, we drew $5.0 million on our revolving line for strategic operating purposes. As of January 31, 2017, we allocated
$5.3 million under the letter of credit facility as security in favor of certain landlords for office space.
Cash Flows
The following table summarizes our cash flows:
|
|
|
|
|
|
|
|
|
|
|
|
|
Fiscal year ended January 31, |
|
|
|
2015 |
|
2016 |
|
2017 |
|
|
|
(in thousands)
|
|
Cash flows used in operating activities |
|
$ |
(14,226 |
) |
$ |
(10,525 |
) |
$ |
(7,743 |
) |
Cash flows used in investing activities |
|
|
(7,836 |
) |
|
(10,005 |
) |
|
(3,803 |
) |
Cash flows provided by financing activities |
|
|
50,362 |
|
|
1,647 |
|
|
5,968 |
|
Cash used in operating activities of $7.7 million for the fiscal year ended January 31, 2017 was primarily due to a net loss of
$43.2 million, partially offset by stock-based compensation of $9.9 million, the release of $5.8 million of restricted cash primarily associated with amounts previously held as
collateral against our office leases, and depreciation and amortization of $4.1 million. The net change in operating assets and liabilities was primarily due to a change in the deferred revenue
balance of $20.9 million and accounts receivable balance of $4.1 million, mainly due to timing of billing and cash collections during the period. The increase in accounts payable,
accrued expenses and other current liabilities of $6.0 million was offset by increases in prepaid expenses and other current assets of $1.6 million and deferred commissions of
$5.6 million. The increase in deferred commissions reflected the growth in headcount and sales resulting in increased compensation and sales commissions.
Cash
used in operating activities of $10.5 million for the fiscal year ended January 31, 2016 was primarily due to a net loss of $26.5 million, partially offset by
stock-based compensation of $4.5 million and depreciation and amortization of $3.1 million. The net change in operating assets and liabilities was primarily due to a change in the
deferred revenue balance of $12.9 million, partially offset by an increase in accounts receivable of $12.1 million, mainly due to timing of billing and cash collections during the
period. The change in accounts payable, accrued expenses and other current liabilities of $8.3 million was attributable to an increase in compensation cost due to headcount growth, as well as
future payments for sales tax due to customer billing. The change in deferred rent of $2.1 million was related to a tenant improvement allowance received for the leasehold improvements in our
New York headquarters. These changes were offset by changes in prepaid expenses and other current assets of $0.2 million. The changes were attributable to increased spending related to
operational growth of our business.
Cash
used in operating activities of $14.2 million for the fiscal year ended January 31, 2015 was primarily due to a net loss of $17.3 million, partially offset by
stock-based compensation of $2.9 million and depreciation and amortization of $1.2 million. The net change in operating assets and liabilities was primarily due to a change in the
deferred revenue balance of $6.9 million, partially offset by an increase in accounts receivable of $5.0 million, mainly due to timing of billing and cash collections during the period.
The change in accounts payable, accrued expenses and other current liabilities of $1.1 million was attributable to an increase in compensation cost due to headcount growth, as well as future
payments for sales tax due to customer billing. These changes were offset by changes in prepaid expenses and other
63
Table of Contents
current
assets of $1.1 million. The changes were attributable to increased spending related to operational growth of our business.
Cash used in investing activities for the fiscal year ended January 31, 2017 was $3.8 million and primarily related to capital
expenditures of $3.5 million.
Cash
used in investing activities for the fiscal year ended January 31, 2016 was $10.0 million and primarily related to capital expenditures, largely associated with
leasehold improvements in our New York headquarters.
Cash
used in investing activities for the fiscal year ended January 31, 2015 was $7.8 million and primarily related to our acquisition of Inner Balloons
Consulting B.V., a Dutch company, in December 2014 to facilitate our operations in Europe. Cash used in investing activities was also affected by capital expenditures, largely associated with
leasehold improvements in our New York headquarters.
Cash provided by financing activities for the fiscal year ended January 31, 2017 was $6.0 million and primarily related to
$5.0 million drawn on our revolving credit line, as well as $1.3 million of proceeds from the exercise of stock options, partially offset by payments of deferred offering costs and
deferred financing costs.
Cash
provided by financing activities for the fiscal year ended January 31, 2016 was $1.6 million, which consisted primarily of $28.3 million used for share
repurchases pursuant to a tender offer and stock option settlements in connection with the tender offer, offset by $29.5 million in proceeds from the contemporaneous sale of common stock to
existing investors and $0.4 million in proceeds from the exercise of stock options.
Cash
provided by financing activities for the fiscal year ended January 31, 2015 of $50.4 million consisted almost entirely of proceeds from the sale of our Series F
preferred stock.
Contractual Obligations
Our principal commitments and contractual obligations consist of obligations under operating leases for office facilities, the agreements for
which expire at various dates between fiscal years 2017 and 2022, including a long-term operating lease for our primary facility in New York which expires in December 2020, and our various agreements
with PowerListings Network application providers, which agreements expire at various dates between fiscal years 2017 and 2020.
We
typically enter into multiyear arrangements with our PowerListings Network application providers, many of which automatically renew at the end of the stated contractual term. With
certain application providers, we operate under the application provider's standard terms and conditions and we do not
pay a fee. For contracts involving a payment by us to the PowerListings Network application provider, there is typically either a fixed fee or variable fee structure. The variable fee structure
differs across our contracts and may consist of an amount based on the number of listings provided or a percentage of our revenues. Because there is a variable fee aspect to our relationships with the
PowerListings Network, the growth of our business, whether through an increase in our revenues, an increase in our customers, or an increase in the locations managed on our platform, will result in
increased payments to certain PowerListings Network application providers. These contracts are typically terminable by either party only upon an uncured material breach.
64
Table of Contents
The
following table summarizes our non-cancelable contractual obligations as of January 31, 2017 (in thousands):
|
|
|
|
|
|
|
|
|
|
|
Payments due by period
|
|
Application Provider
Obligations(1) |
|
Operating Lease
Obligations |
|
Total |
|
Less than 1 Year |
|
$ |
13,964 |
|
$ |
6,905 |
|
$ |
20,869 |
|
1 - 2 Years |
|
|
4,407 |
|
|
6,969 |
|
|
11,376 |
|
3 - 5 Years |
|
|
1,100 |
|
|
14,408 |
|
|
15,508 |
|
|
|
|
|
|
|
|
|
|
|
|
|
Total obligations |
|
$ |
19,471 |
|
$ |
28,282 |
|
$ |
47,753 |
|
|
|
|
|
|
|
|
|
|
|
|
|
|
|
|
|
|
|
|
|
|
|
|
|
|
|
|
|
|
|
|
|
|
|
|
|
- (1)
- Includes
the minimum commitment levels of any variable payments to PowerListings Network application providers. We have contractual minimum
commitments with certain of our PowerListings Network application providers.
Off-Balance Sheet Arrangements
We do not engage in transactions that generate relationships with unconsolidated entities or financial partnerships, such as entities often
referred to as structured finance or special purpose entities, as part of our ongoing business. Accordingly, our operating results, financial condition and cash flows are not subject to off-balance
sheet risks.
Critical Accounting Policies and Estimates
Our management's discussion and analysis of our financial condition and results of operations is based on our financial statements, which have
been prepared in accordance with accounting principles generally accepted in the United States, or GAAP. The preparation of these financial statements requires us to make estimates and assumptions
that affect the reported amounts of assets and liabilities and the disclosure of contingent assets and liabilities at the date of the financial statements, as well as the reported revenues generated
and expenses incurred during the reporting periods. Our estimates are based on our historical experience and on various other factors that we believe are reasonable under the circumstances, the
results of which form the basis for making judgments about the carrying value of assets and liabilities that are not readily apparent from other sources. Actual results may differ from these estimates
under different assumptions or conditions. We believe that the accounting policies discussed below are critical to understanding our historical and future performance, as these policies relate to the
more significant areas involving management's judgments and estimates.
Revenue Recognition
We derive our revenue primarily from subscription services. We sell subscriptions to our platform through contracts that are typically one year
in length, but may be up to three years or longer in length. The subscription contracts do not provide customers with the right to take possession of the software supporting the applications and, as a
result, are accounted for as service contracts.
We
sell our products through our direct sales force to our customers, including third-party resellers. We recognize revenue when four basic criteria are met: (1) persuasive
evidence exists of an arrangement with the customer reflecting the terms and conditions under which the services will be provided; (2) services have been provided or delivery has occurred;
(3) the fee is fixed or determinable; and (4) collection is reasonably assured. Collectability is assessed based on a number of factors, including the creditworthiness of a customer and
transaction history.
We
recognize revenue based on the amount billed to customers, including third-party resellers. Our revenue consists solely of contractual fees for subscription and support services
charged to our customers on a per-location basis. In transactions with resellers, we contract only with the reseller, in which pricing, length of subscription and support services are agreed upon. The
reseller negotiates the price charged and length of subscription and support service directly with its customers. We do not pay separate fees to third-party resellers and do not have direct
interactions with the resellers' customers.
65
Table of Contents
Subscription Revenue. Subscription revenue recognition commences on the date that our platform is made
available to the customer, which is the
subscription start date, provided all of the other criteria described in the preceding paragraphs are met. Revenue is recognized based on the terms of the customer contracts, which include a fixed fee
based upon the actual or contractual number of locations, and is recognized on a straight-line basis over the contractual term of the arrangement.
Multiple Deliverable Arrangements. Certain of our arrangements include both a subscription to our
platform and support services. We evaluate each
element in an arrangement to determine whether it represents a separate unit of accounting. An element constitutes a separate unit of accounting when the delivered item has standalone value and
delivery of the undelivered element is probable and within our control. Our support services are not sold separately from the subscription and there is no alternative use for them. Further, no other
vendor provides similar support services. Based on these factors, the support services do not have standalone value. Accordingly, subscription and support revenue is combined and recognized as a
single unit of accounting.
We
generally recognize the fixed portion of subscription fees and support services fees ratably over the contract term. Recognition begins when the customer has access to our platform
and the support services have commenced.
Deferred Revenue. Deferred revenue primarily consists of billings or payments received in advance of
revenue recognition from subscription services
described above and is reduced as the revenue recognition criteria are met. The deferred revenue balance is influenced by several factors, including seasonality, the compounding effects of renewals,
invoice duration, invoice timing and size.
Deferred
revenue that will be recognized during the succeeding twelve-month period is recorded as current deferred revenue within current liabilities. Typically, invoices are issued for
a period of 12 months or less. In those instances when invoicing is for a period greater than 12 months, the portion of the invoice that is for the period past 12 months is
recorded as long-term deferred revenue within other long-term liabilities in our consolidated balance sheets.
Deferred Commissions
We capitalize commission costs that are incremental and directly related to selling subscription contracts to customers and consist of sales
commissions paid to our direct sales force. Our subscription contracts are predominantly non-cancelable in nature. Commissions are earned by sales personnel upon the execution of the sales contracts,
and commission payments are made shortly after they are earned.
Commission
costs that are direct and incremental to selling revenue-generating customer contracts are deferred and amortized to sales and marketing expense over the terms of the related
subscription contracts, which are typically one year in length but may be up to three years or longer in length. The deferred commission amounts are recoverable through the future revenue streams
under the customer contracts.
We
capitalized commission costs of $3.8 million and $10.3 million during the fiscal years ended January 31, 2016 and 2017, respectively. Capitalized commission costs
are included in deferred commissions and other long term assets on our consolidated balance sheets.
Amortization
of deferred commissions of $1.6 million, $2.3 million and $4.7 million was included in sales and marketing expense in the accompanying consolidated
statements of operations and comprehensive loss for the fiscal years ended January 31, 2015, 2016 and 2017, respectively.
Stock-Based Compensation
Compensation cost for all stock-based awards, including options to purchase stock and restricted stock units, or RSUs, is measured at fair value
on the date of grant and recognized over the service period. The fair value of stock options is estimated on the date of grant using a Black-Scholes model. The fair value of
66
Table of Contents
RSUs
awarded is estimated on the date of grant based on the fair value of our common stock. Compensation cost is recognized over the requisite service periods of awards, which is typically four years
for options and one to three years for RSUs.
Our
use of the Black-Scholes option-pricing model requires the input of highly subjective assumptions, including the fair value of our underlying common stock, expected term of the
option, expected volatility of the price of our common stock, risk-free interest rates, and the expected dividend yield of our common stock. The assumptions used in our option-pricing model represent
management's best estimates. These estimates involve inherent uncertainties and the application of management's judgment. If factors change and different assumptions are used, our stock-based
compensation expense could be materially different in the future.
These
assumptions and estimates are as follows:
- •
- Fair Value of Common Stock. As our stock is not publicly traded, we
estimate the fair value of common stock as discussed in "Common Stock Valuations" below.
- •
- Expected Term. The expected term of employee stock options represents the
weighted-average period that the stock options are expected to remain outstanding. To determine the expected term, we generally apply the simplified approach in which the expected term of an award is
presumed to be the mid-point between the vesting date and the expiration date of the award as we do not have sufficient historical exercise data to provide a reasonable basis for an estimate of
expected term.
- •
- Risk-Free Interest Rate. We base the risk-free interest rate on the yields
of U.S. Treasury securities with maturities approximately equal to the term of employee stock option awards.
- •
- Expected Volatility. As we do not have a trading history for our common
stock, the expected volatility for our common stock was estimated by taking the average historic price volatility for industry peers based on daily price observations over a period equivalent to the
expected term of the stock option awards. Industry peers consist of several public companies in our industry which are either similar in size, stage of life cycle or financial leverage.
The
estimated forfeiture rate applied is based on historical forfeiture rates. The estimated number of stock awards that will ultimately vest requires judgment, and to the extent actual
results or updated estimates differ from our current estimates, such amounts will be recorded as a cumulative adjustment in the period during which the estimates are revised.
Common Stock Valuations
We have historically granted stock options at exercise prices equal to the fair value as determined by our Board of Directors on the date of
grant. In the absence of a public trading market, the Board of Directors, with input from management, exercised significant judgment and considered numerous objective and subjective factors to
determine the fair value of our common stock as of the date of each stock option and RSU grant, including:
- •
- our financial performance;
- •
- the rights, preferences and privileges of our convertible preferred stock relative to those of the common stock; and
- •
- general economic and financial conditions, and the trends specific to the markets in which we operate.
In
addition, our Board of Directors considered the independent valuations completed by a third-party valuation consultant. Valuations were generally performed as of a date immediately
preceding the regularly scheduled Board of Directors meeting. The valuations of our common stock were determined in accordance with the guidelines outlined in the American
Institute of Certified Public Accountants Practice
67
Table of Contents
Aid, Valuation of Privately-Held-Company Equity Securities Issued as Compensation. In performing these valuations, a variety of relevant factors were considered including,
but
not limited to:
- •
- our nature and history;
- •
- the financial and economic conditions affecting the general economy, our company and the industry;
- •
- our past results, current operations and future prospects;
- •
- our earnings capacity;
- •
- our economic benefit of both the tangible and intangible assets;
- •
- the market prices of actively traded interests in public entities engaged in the same or similar lines of business, as well as sales of
ownership interests in similar entities; and
- •
- the prices, terms and conditions of past sales of our company's ownership interests.
In
valuing the common stock, our enterprise value was estimated by utilizing the Probability-Weighted Expected Return Method, or PWERM, allocation method and the market approach. The
market-based approach considers multiples of financial metrics based on trading multiples of a selected peer group of companies in similar lines of business. For each of the possible events, a range
of future equity values is estimated, based on the market approach discussed above and over a range of possible liquidity event dates, all plus or minus a standard deviation for value and timing. The
timing of these events is based on our expectations. In each valuation approach, the firm value is allocated across the capital structure using an option pricing model, which recognizes the economic
characteristics of each security and assigns value to each class based on those characteristics. A marketability discount was applied to the common stock in each valuation in order to recognize the
inherent illiquidity in holding stock of a privately held company.
Two
possible events were considered for estimating firm value. The first possible event, which assumed that we would complete an initial public offering, or IPO, utilized a market-based
approach. The second possible event, which assumed that we would remain a private company or experience a liquidation event other than an IPO, also utilized the market approach. In estimating the
common stock value, a probability was assigned to each of the possible events based on an analysis of prevailing IPO market conditions, recent acquisitions and input from management.
68
Table of Contents
The
following table summarizes all stock option and restricted stock unit grants from October 31, 2015 through January 31, 2017, the date of our most recently closed fiscal
period:
|
|
|
|
|
|
|
|
|
|
|
|
|
Grant Date
|
|
Type of Award |
|
Number of Shares of
Common Stock
Underlying Grant |
|
Grant Date Fair
Value Per Share |
|
Exercise Price Per
Share (for Options
Only) |
|
November 5, 2015 |
|
Options |
|
|
7,000 |
|
$ |
5.00 |
|
$ |
5.00 |
|
December 3, 2015 |
|
Options |
|
|
1,396,000 |
|
|
6.05 |
|
|
6.05 |
|
January 11, 2016 |
|
Restricted stock units |
|
|
20,000 |
|
|
6.08 |
|
|
— |
|
January 15, 2016 |
|
Restricted stock units |
|
|
20,000 |
|
|
6.08 |
|
|
— |
|
March 10, 2016 |
|
Options |
|
|
942,500 |
|
|
6.11 |
|
|
6.11 |
|
March 17, 2016 |
|
Restricted stock units |
|
|
20,000 |
|
|
6.18 |
|
|
— |
|
April 28, 2016 |
|
Options |
|
|
2,330,000 |
|
|
6.11 |
|
|
6.11 |
|
June 9, 2016 |
|
Options |
|
|
839,300 |
|
|
6.48 |
|
|
6.48 |
|
June 9, 2016 |
|
Restricted stock units |
|
|
200,000 |
|
|
6.48 |
|
|
— |
|
September 9, 2016 |
|
Options |
|
|
1,482,500 |
|
|
6.58 |
|
|
6.58 |
|
September 9, 2016 |
|
Restricted stock units |
|
|
10,000 |
|
|
6.58 |
|
|
— |
|
December 7, 2016 |
|
Options |
|
|
1,283,500 |
|
|
7.18 |
|
|
7.18 |
|
December 7, 2016 |
|
Restricted stock units |
|
|
60,000 |
|
|
7.18 |
|
|
— |
|
December 15, 2016 |
|
Options |
|
|
455,000 |
|
|
7.18 |
|
|
7.18 |
|
January 9, 2017 |
|
Options |
|
|
1,111,000 |
|
|
7.18 |
|
|
7.18 |
|
January 17, 2017 |
|
Options |
|
|
1,259,000 |
|
|
7.18 |
|
|
7.18 |
|
Subsequent
to January 31, 2017, we granted options to purchase an aggregate of 799,250 shares of our common stock with exercise prices ranging from $8.59 to $9.00 per share.
Once
we are operating as a public company, we will rely on the closing price of our common stock as reported on the date of grant to determine the fair value of our common stock.
Based
on the initial public offering price per share of $11.00, the aggregate intrinsic value of our outstanding stock awards as of January 31, 2017 was $187.4 million, of
which $121.6 million related to vested awards and $65.8 million related to unvested awards.
Emerging Growth Company Status
Section 107 of the JOBS Act provides that an emerging growth company can take advantage of the extended transition period provided in
Section 7(a)(2)(B) of the Securities Act for complying with new or revised accounting standards. Thus, an emerging growth company can delay the adoption of certain accounting standards until
those standards would otherwise apply to private companies. We have elected to avail ourselves of this extended transition period and, as a result, we will not adopt new or revised accounting
standards on the relevant dates on which adoption of such standards is required for other public companies until required by private company accounting standards.
Recent Accounting Pronouncements
In May 2014, the Financial Accounting Standards Board, or FASB, issued Accounting Standards Update, or ASU, No. 2014-09, "Revenue from
Contracts with Customers (Topic 606)", or ASU 2014-09. ASU 2014-09 establishes principles for recognizing revenue upon the transfer of promised goods or services to customers, in an amount that
reflects the expected consideration received in exchange for those goods or services. ASU 2014-09 is effective for public entities for annual reporting periods, and interim periods within those annual
reporting periods, beginning after December 31, 2017. For all other entities, including emerging growth companies, the standard is effective for annual reporting periods beginning after
December 15, 2018, and interim periods within annual reporting periods, beginning after December 15, 2019. Early adoption of this standard is permitted for all entities. The guidance
allows for the amendment to be applied either retrospectively to each prior reporting period presented or
69
Table of Contents
retrospectively
as a cumulative-effect adjustment as of the date of adoption. We plan to adopt this standard under a modified retrospective transition method and are currently evaluating the impact.
In
February 2016, the FASB issued ASU No. 2016-02, "Leases," which will require lessees to recognize a right-of-use asset and a lease liability, initially measured at the present
value of the lease payments, on its balance sheet for operating leases. The standard also requires a lessee to recognize a single lease cost, calculated so that the cost of the lease is allocated over
the lease term, on a generally straight-line
basis. The standard is effective for public entities for annual reporting periods, and interim periods within those annual reporting periods, beginning after December 15, 2018. For all other
entities, including emerging growth companies, the standard is effective for annual reporting periods beginning after December 15, 2019, and interim periods within annual reporting periods
beginning after December 15, 2020. We are evaluating the potential impact of adopting this new accounting guidance.
In
March 2016, the FASB issued ASU No. 2016-09, "Stock Compensation: Improvements to Employee Shared-Based Payment Accounting," which simplifies and improves several aspects of
the accounting for employee share-based payment transactions for public entities. The guidance will require all tax effects related to share-based payments at settlement or expiration to be recorded
through the income statement and be reported as operating activities on the statement of cash flows. Further, under the new guidance, entities are permitted to make an accounting policy election for
the impact of forfeitures on the recognition of expense for share-based payment awards, whereby forfeitures can be estimated, as required today, or recognized when they occur. The standard is
effective for public entities for annual reporting periods, and interim periods within those annual periods, beginning after December 15, 2016. For all other entities, including emerging growth
companies, the standard is effective for annual periods beginning after December 15, 2017, and interim periods within annual periods beginning after December 15, 2018. Early adoption is
permitted for any entity in any interim or annual period. We are evaluating the potential impact of adopting this new accounting guidance.
Quantitative and Qualitative Disclosures about Market Risk
Market risk represents the risk of loss that may affect our financial position due to adverse changes in financial market prices and rates. We
are exposed to market risks related to foreign currency exchange rates, inflation and interest rates.
Foreign Currency Risk
Assets and liabilities of non-U.S. subsidiaries that operate in a local currency environment, where the local currency is the functional
currency, are translated from foreign currencies into U.S. dollars using month-end rates of exchange for assets and liabilities, and average rates for the period derived from month-end spot rates for
revenues, costs and expenses. We record translation gains and losses in accumulated other comprehensive income as a component of stockholders' deficit. We reflect net foreign exchange transaction
gains and losses resulting from the conversion of the transaction currency to functional currency as a component of foreign currency exchange losses in other income (expense), net.
Based
on the size of our international operations and the amount of our expenses denominated in foreign currencies, we would not expect a 10% decline in the value of the U.S. dollar from
rates on January 31, 2017 to have a material effect on our financial position or results of operations.
Inflation Risk
We do not believe that inflation has had a material effect on our business, financial condition or results of operations, other than its impact
on the general economy. Nonetheless, if our costs were to become subject to inflationary pressures, we may not be able to fully offset such higher costs through price increases. Our inability or
failure to do so could harm our business, financial condition and results of operations.
70
Table of Contents
Interest Rate Risk
We had cash and cash equivalents of $24.4 million as of January 31, 2017. We consider all cash investments available with original
maturities of three months or less to be cash, and such investments consist of high-yield savings accounts. Cash includes investments in money market funds and is stated at cost. The carrying amount
of our cash equivalents reasonably approximates fair value due to the short-term maturities of these instruments. The primary objective of our investments is the preservation of capital to fulfill
liquidity needs. We do not enter into investments for trading or speculative purposes.
We
do not believe our cash equivalents have significant risk of default or illiquidity. While we believe our cash equivalents do not contain excessive risk, we cannot assure you that in
the future our investments will not be subject to adverse changes in market value. In addition, we maintain significant amounts of cash and cash equivalents at one or more financial institutions that
are in excess of federally insured limits and are exposed to counterparty risk.
We
had total outstanding debt of $5.0 million as of January 31, 2017 under our revolving credit line with Silicon Valley Bank. The line of credit carries a variable
interest rate equal to the prime rate plus 0.5% and is available through March 16, 2018.
We
have not been exposed to, nor do we anticipate being exposed to, material risks due to changes in interest rates. A hypothetical 10% change in interest rates during any of the periods
presented would not have had a material impact on our financial statements.
71
Table of Contents
BUSINESS
Overview
Yext is a knowledge engine. Our platform lets businesses manage their digital knowledge in the cloud and sync it to over 100 services including
Apple Maps, Bing, Cortana, Facebook, Google, Google Maps, Instagram, Siri and Yelp. Digital knowledge is the structured information that a business wants to make publicly accessible. For example, in
food service, the address, phone number or menu details of a restaurant; in healthcare, the health insurances accepted by a physician or the precise drop-off point of the emergency room at a hospital
campus; or in finance, the ATM locations, retail bank holiday hours or insurance agent biographies. We believe a business is the ultimate authority on its own digital knowledge, and it is our mission
to put that business in control of it, everywhere.
Intelligent
search, which are searches of digital knowledge that combine context and intent, has grown significantly in recent years. In particular, searches that return maps in the
results have grown significantly with the proliferation of mobile devices. According to Think with Google, an online source of marketing research published by Google, location-based searches now make
up 30% of all mobile searches. Searches for categories, such as "restaurants", "wine", "insurance", "wealth advisor" or "doctor", or for specific brands, such as "Marriott", "McDonald's" or "Home
Depot", return maps directly in the search results. The source of the results for each of these searches is not a web page—it is structured data. Businesses and service providers want
their digital knowledge to be accurate, compelling and more prominent than that of their competitors when consumers look for them on search platforms, applications, social media, connected devices and
other digital sources. Our solution drives commerce by providing real-time digital knowledge that allows consumers to find the businesses and service providers that are most relevant to them.
The
vast majority of digital knowledge provided by searches currently comes from third-party sources such as data aggregators, governmental agencies and consumers. The net result of this
third-party sourcing has been to produce "best guess" data that can often miss or misstate the true digital knowledge for businesses worldwide. We pioneered a better way to source critical digital
knowledge. We have built our business on the fundamental premise that the best source of accurate and timely digital knowledge about a business is the business itself. We have established direct data
integrations between our software and the over 100 members of our PowerListings Network that end consumers around the globe use to discover new businesses, read reviews and find accurate answers to
their queries. These integrations include Apple Maps, Bing, Facebook, Google, Google Maps, Instagram, Yelp and many others. Our platform uses our patented Match & Lock process to ensure that
our customers' digital knowledge is in sync across our PowerListings Network. Businesses can directly control their own digital knowledge rather than leaving it in the hands of third parties, thereby
making our platform the system of record for such vital knowledge.
We
also make search intelligent by helping to provide precise, accurate and current answers to location-based queries that are conducted across web and mobile applications and voice and
artificial intelligence, or AI, engines. We are increasingly using the structured data on our platform to expand or add new integrations with vertically specialized applications, voice-based search
and AI engines. Our provision of structured digital knowledge, directly produced and managed by businesses and
professional service providers themselves, helps ensure the accuracy of search results whether they are presented in traditional search results, an information card or an answer from a digital
assistant.
The
Yext Knowledge Engine is the core of our platform and enables businesses and professional service providers of all sizes—from one location to
thousands—to:
- •
- modify, enhance and manage digital knowledge attributes for each of their locations;
- •
- modify, enhance and manage location and other digital knowledge attributes for service providers in the financial, healthcare, insurance, real
estate and other agent-based industries;
72
Table of Contents
- •
- update once and immediately disseminate changes to their listings across the most widely used third-party maps, apps, search engines,
intelligent GPS systems, digital assistants, vertical directories and social networks that consumers rely upon today;
- •
- create and update search-optimized local pages;
- •
- encourage consumer reviews for inclusion on their local pages and third-party review providers; and
- •
- analyze how listings, pages and reviews are driving consumer engagement.
We
offer our cloud-based Knowledge Engine solution to customers on a subscription basis in several packages. Each package provides varying levels of access to our key Listings, Pages and
Reviews features. Our Listings feature provides customers with control over the digital presence of their location and other related attributes published on the most widely used third-party
applications. Our Pages feature gives our customers the ability to create individual pages for their business, enabling control over the image and efficacy of their digital appearance on their own
sites. Our Reviews feature enables customers to encourage and facilitate reviews, thereby increasing the quantity and quality of the reviews available to potential consumers and improving the search
relevance for their businesses on our PowerListings Network. Ultimately, these and our other features and solutions help ensure that the critical digital knowledge created by businesses and
professional service providers and delivered to the consumer is accurate, consistent, up to date and compelling.
Businesses
and professional service providers of nearly all sizes can benefit from our platform and capabilities. Today, our customers use our platform to manage digital knowledge
covering more than 17 million attributes and over 925,000 locations. These include leading businesses in a diverse set of industries, such as healthcare and pharmaceuticals, retail, financial
services, manufacturing and technology. Our customers include AutoZone, Ben & Jerry's, Best Buy, Citi, Denny's, Farmers Insurance Group, H&R Block, HCA, Infiniti, Marriott, Michael's,
McDonald's, Rite Aid, Steward Health Care and many others.
We
have experienced rapid growth in recent periods. For our fiscal years ended January 31, 2015, 2016 and 2017, our revenues were $60.0 million, $89.7 million and
$124.3 million, respectively, our net loss was $17.3 million, $26.5 million and $43.2 million, respectively, and our non-GAAP net loss was $14.4 million,
$22.0 million and $33.3 million, respectively.
Industry Background
Consumer Discovery Has Changed
How individuals discover, learn about and ultimately visit businesses and purchase services and products continues to evolve. Intelligent search
has grown significantly in recent years. From 2015 to 2016, mobile searches for "stores open now" or "food open now" increased by 210% according to March 2016 Google trends, and mobile searches for
"where to buy/find/get" increased by 130% according to February 2016 Google search data. Services are now able to leverage intelligent search that combines context and intent to help individuals
discover what they need without having to necessarily visit the business's own website and return digital knowledge, such as location and other related data, for nearly any search. Search applications
now typically return direct answers based on context, and direct answers for a location query are often maps. For example, a search for "steak" returns a map and additional location information for
nearby restaurants that offer steak on the menu, are currently open, are highly rated and have table availability. A search for "doctors" or "insurance" returns a map and additional location
information for nearby insurance agents, their hours and their rating. According to Think with Google, mobile-centric "near me" searches grew 146% from 2014 to 2015.
73
Table of Contents
Knowledge Is Fundamental.
Consumers expect instant information. When a consumer looks up an Apple Store or McDonald's from their smartphone, that consumer expects that
digital knowledge to be accurate. Businesses spend significant sums on developing their brands and creating product and market awareness through expensive and ongoing advertising campaigns conducted
across various forms of media including television, web and social. When potential consumers reached through those campaigns want to make a purchase, businesses need to make sure that they can be
found efficiently by ensuring that digital knowledge is widely available, up to date and correct. Inaccurate or incomplete information results in lost sales opportunities, negative brand experiences
and organizational inefficiencies for businesses.
Intelligent Search Drives Commerce.
According to the U.S. Census Bureau, approximately 92% of U.S. retail sales occurred at physical locations during 2016. When searching for a
business, consumers need to know many relevant attributes such as the address, phone number, menu options of a restaurant or operating hours. As a result, businesses and professional service providers
must ensure that their digital knowledge is available, accurate and consistent so that they can be found. Moreover, businesses and professional service providers want to make sure that they appear
prominently online when nearby consumers search for them. According to Think with Google, 76% of location searches in the United States in May 2016 resulted in visits to a business within one day of
the search and 28% of those searches resulted in a purchase.
Managing Digital Knowledge Is Challenging
Many businesses lack the capabilities to effectively control, structure and manage their digital knowledge across the ecosystem of apps where
consumers discover businesses. This lack of management capability is due to several factors:
- •
- Lack of Control of Digital
Knowledge. The vast majority of digital knowledge currently comes from third-party sources such as data aggregators, governmental agencies and
consumers. For example, within every business profile it provides, Google offers a "Suggest an Edit" link that allows any consumer—regardless of business affiliation—to suggest
location data changes to a given business, and those suggestions are often inconsistent with the data provided directly by the business. The net result of this third-party sourcing has been to produce
"best guess" data that can often miss or misstate the true digital knowledge for businesses worldwide. For example, if digital knowledge is inaccurate, a consumer may arrive at a store and find it
closed. The rise of smartphones, the mobile web and the app economy means that digital knowledge is being leveraged by consumers more than ever before. As a result, businesses and professional service
providers face increasing challenges to control, manage and publish their digital knowledge.
- •
- Attributes that Comprise Digital Knowledge Are
Expanding. Businesses need to be able to define their digital knowledge using detailed, category specific attributes about their business. These
may range from simple items such as name, address and phone number to more detailed attributes. For example, restaurants can note that they accept reservations or that they offer gluten-free options,
hotels can specify if they welcome dogs, grocery stores can highlight the organic products they offer, doctors can specify what insurance plans they accept and auto dealers can highlight details about
the cars they have in inventory.
- •
- Digital Knowledge Is Dynamic. As
businesses and professional service providers expand the number of attributes that define their digital knowledge, consumers are more easily able to find and transact with them. Digital knowledge
includes dynamic attributes that change frequently, such as opening hours, holiday hours, menus and promotions, further increasing the challenges businesses and professional service providers face in
managing their digital knowledge.
74
Table of Contents
- •
- Digital Knowledge Exists in More
Places. The number of applications that leverage digital knowledge continues to increase. Consumers have moved beyond traditional web search to
vertically specialized applications, intelligent search across web and mobile applications as well as voice and AI engines. With the increasing variety of applications visited by the consumer through
mobile, social and other applications, businesses need an efficient way to manage their digital knowledge across a multitude of services, such as Google, Facebook and Yelp.
Businesses Need to Provide Customers with Relevant and Actionable Information
With 30% of all mobile searches related to location, businesses need to have their locations appear at the top of search results conducted on
mobile devices, where there is limited space for multiple search results. When consumers search for businesses, they expect to be able to quickly find all of the relevant digital knowledge they need
about those organizations, such as a description, the nearest store if it is a chain, the actual location on a map, the ability to make an appointment if it is a business such as an insurance agent,
or search for a menu item if it is a restaurant. Furthermore, the
increase in the number of mobile users around the world has resulted in the need for business information to be available on the applications where consumers engage and to be presented in a way that
is consistent with the language and customs of each geography in which consumers reside.
Existing Alternatives are Inadequate
Traditionally, businesses and professional service providers have managed digital knowledge about location, if at all, with limited tools.
Traditional methods for managing digital knowledge about location include paper or legacy software-based solutions, such as word processors or spreadsheets. Simply managing and updating the few core
search engines, such as Google and Bing, through these traditional methods is already very challenging, and becomes even more so when implementing updates on newer applications such as Instagram,
Snapchat and Uber. Data uploads are often left to individual location managers or to a single person at a central office, leading to inconsistencies and inaccuracies in data, long times to update or
delays in remediating errors. These methods are generally driven by either:
- •
- Ineffective Legacy Tools. Some
businesses use legacy software provided by large technology companies to manage their digital knowledge about location. This software is not specifically designed for the management of such digital
knowledge, is inefficient, expensive and complex, requires significant technical knowledge and training to install and maintain, and typically takes a long time to deploy. Furthermore, such legacy
software does not provide efficient integrations with the platforms of major applications. Most businesses and professional service providers do not have these tools or are unable to use them
effectively.
- •
- Inefficient Manual
Processes. Many other businesses use manual methods, whereby employees manually edit and update digital knowledge about location data. Location
data is often stored in enterprise databases that are typically controlled by technical, non-marketing personnel, requiring significant resources and time to query access and manipulate data. Edits
are error prone, lack audit trails and are difficult to publish to the vast number of large applications currently used today around the world.
Customer Reviews Are of Critical and Growing Importance
Customer reviews continue to gain more prominence and have become a key factor in decision making. Many major applications, such as Apple Maps,
Bing, Google and Facebook, now include customer review data in their search results. Businesses and professional service providers are now ranked in some major search engines based on the number,
quality and recency of reviews. Reviewers who go to third-party review sites are inherently self-selecting, with the most opinionated and sometimes most dissatisfied consumers often providing many of
the reviews. As a result, many businesses and professional service
75
Table of Contents
providers
either have reviews that skew negatively or fewer reviews than might be desired, in either case providing potential consumers with limited or biased information. A limited number of reviews
or a few poor reviews without offsetting positive reviews may result in businesses being placed further down in the search rankings provided by some applications.
Our Solution—the Yext Knowledge Engine
We offer our Yext Knowledge Engine, a cloud-based global platform that enables businesses to control and manage their digital knowledge and make
it available through our PowerListings Network of over 100 maps, apps, search engines, intelligent GPS systems, digital assistants, vertical directories and social networks in a complete, up to
date and accurate manner. Our solution provides our customers full control over key digital knowledge attributes such as addresses, phone numbers, physician credentials, accepted insurance plans,
holiday hours, appointment times and menu options. Our platform serves as the system of record for the vital digital knowledge used internally to execute operations and distributed externally across
the PowerListings Network. The core of our platform is our global Knowledge Engine, which powers our Listings, Pages and Reviews features. We currently offer packages that include some or all of these
and other features depending on the subscription level purchased. The key features of our platform are as follows:
- •
- Our Listings feature allows customers to manage their location-related data across our PowerListings Network on the most widely used maps,
apps, search engines, intelligent GPS systems, digital assistants, vertical directories and social networks from a single source.
- •
- Our Pages feature allows customers to establish landing pages on their own websites, including for individual locations or for individual
professional service providers that vary by location, and to manage rich and compelling digital content on those sites, including calls to action.
- •
- Our Reviews feature enables customers to encourage and facilitate reviews from their end consumers, thereby increasing the quantity and quality
of the reviews available to potential consumers, the tools to manage their reviews from multiple sources from a single location, and the ability to help strengthen their reviews across our
PowerListings Network.
Our
analytics engine is integrated into our Knowledge Engine platform and provides businesses with insight into their public presence across services. We give our customers end-to-end
control over critical business information.
Key Benefits to Our Platform
Our global Knowledge Engine provides the following benefits depending on a customer's subscription level and enabled
features:
- •
- Control over Digital
Knowledge. Accurate digital knowledge and enhanced, engaging content drive consumers into stores and to purchase products and services. Our
platform is the system of record that enables our customers to be the single source of truth for their information everywhere. Our customers quickly gain control of their digital knowledge, such as
their location data, listings and related attributes, resulting in the elimination of inaccurate and duplicate data and the ability to seamlessly update data across all of the applications in our
PowerListings Network, helping to ensure that consistent and up to date digital knowledge is available for consumers.
- •
- Flexibility for Optimized Management of Digital Knowledge
Attributes. Our technology enables businesses to develop structured digital knowledge using standardized schema.org-defined best practices that
suit their business needs and is optimized for search and discovery. Schema.org is an open and collaborative initiative launched by some of the largest search engines that defines the vocabulary and
format for structured data markup. Regardless of the permissions model deployed, whether managed centrally or at individual business sites, our platform ensures that changes made
76
Table of Contents
are
pushed across all of the applications in our PowerListings Network in real-time or near real-time depending on the integration. Our solution gives businesses the ability to organize, edit and
update digital knowledge based on numerous standard attribute fields, such as address and hours of operation, and increase the depth of their digital knowledge using our extensible custom fields, such
as menu options and accepted insurance plans.
- •
- Direct Integrations with the Most Relevant
Services. Digital knowledge posted on large search platforms, such as Apple Maps, Bing and Google, is highly visible. Inaccuracies and
inconsistencies regarding the location, services, places, products, hours, events and reviews associated with businesses can cause significant negative impact. Traditional methods for managing digital
knowledge, including location and other related data, are highly manual, time-consuming and error-prone. Our platform, coupled with our PowerListings Network of over 100 maps, apps, search engines,
intelligent GPS systems, digital assistants, vertical directories and social networks, provides our customers with the ability to update their digital knowledge and content across all of these
applications with a single click. Consumers can use any application and receive the same accurate, complete and compelling information.
- •
- Ability to Create Compelling Local Pages for
Consumers. Our Pages feature enables businesses to create a compelling online consumer experience utilizing rich content that accurately
represents their brands and establishes a consumer call to action. With Pages, our platform automatically creates and publishes individual pages that a business can manage, such as separate pages for
each store, insurance agent or doctor's office. Our content customization technology allows customers to publish information in accordance with schema.org that is easily crawled by search engines,
rich in content, and optimized for any device. Our customers' local pages can include calls to action, allowing consumers to book an appointment with a financial advisor or order a meal. Our software
allows these calls to action to be integrated with other enterprise systems employed by our customers.
- •
- Ability to Drive More Reviews and Increase Consumer
Engagement. Reviews are now more critical than ever. Our Reviews feature helps our customers to gather additional genuine consumer reviews, which
typically raises their published overall consumer satisfaction score by encouraging consumers who may not otherwise write reviews to do so. This increased review activity helps our customers in two
ways. First, many major search engines now publish reviews alongside digital knowledge and rank search results based on the number, quality and recency of review data, all of which can be enhanced by
our Reviews function. Second, incremental positive reviews can help drive increased sales.
- •
- Ability to Perform Advanced
Analytics. Our platform provides businesses with the ability to perform advanced analytics. This capability provides businesses and professional
service providers with insight into how their public presence across the PowerListings Network drives their revenue. Using our analytics platform, businesses and professional service providers can
monitor search impressions and click volume by URL, app, time, store, region and other attributes. As digital knowledge increasingly drives commerce, businesses and professional service providers can
use this information to monitor the return on their marketing investments.
- •
- Global Reach and Local
Expertise. With our platform's functionality in over 160 countries and over 90 languages and dialects, our solutions enable global businesses to
deliver a local experience regardless of where consumers are located. Our platform integrates with both global and country-specific search engines and applications, accepts international address and
phone number data, and allows local employees to contribute individual expertise, providing a consumer experience that respects local languages, address formats and customs.
77
Table of Contents
Our Competitive Strengths
We believe our competitive strengths include:
- •
- Leading Technology Platform. Our
solution was built from the ground up as a cloud application. As a result, our total cost of ownership for a customer is low, our deployment times are short, and we can easily deploy the latest
updates and upgrades to all of our customers through our cloud-based platform. We developed and patented a process called Match & Lock that enables our customers to sync digital knowledge about
their managed attributes across our PowerListings Network. Our Dual-Sync technology, which is also patented, automatically populates updates that are made in our Knowledge Engine across these
applications.
- •
- Extensive PowerListings
Network. We have deep technology integrations with major global maps, apps, search engines, intelligent GPS systems, digital assistants,
vertical directories and social networks, such as Apple Maps, Bing, Facebook, Google, Google Maps, Instagram and Yelp. Our PowerListings Network includes over 100 applications. Recently, we have been
adding vertical applications in sectors such as financial services and healthcare, as well as international applications. We have established strong, long-term relationships with the application
providers in our PowerListings Network over the past five years since we began offering our Listings feature. Direct integrations and custom application program interfaces, or APIs, between our
Knowledge Engine and PowerListings Network applications position us to deliver control and value both to our customers and those application providers. We collaborate with our PowerListings Network
application providers on technology and location schema so that the solutions we deliver to our customers are optimized for each application, user device and geographic location. Our special
relationships with our PowerListings Network application providers allow our customers to provide the most accurate and consistent digital knowledge to end consumers, whether it is a phone number,
physical address, certification information for an insurance agent or detail regarding an upcoming event.
- •
- Authoritative and Growing Data
Set. As a key system of record for digital knowledge, our customers use our platform to provide information on over 17 million attributes and
over 925,000 locations. Many attributes change frequently, such as holiday hours or menus, and our platform allows our customers to ensure that their information is accurate, up to date and complete.
This digital knowledge set is valuable to applications that want to provide their users with accurate and complete information.
- •
- Focus on Product Innovation. We
have a history of adding innovative new features to our platform:
- •
- We initially created our Listings feature in 2011, allowing businesses to be found virtually everywhere that consumers search. In
2014, we released our Pages feature, which enables our customers to create a page for each location or individual service provider location containing rich content that can be pushed to the top of
local search results and include calls to action. In 2016, we launched our Reviews feature, which allows our customers to encourage and facilitate reviews, thereby increasing the quantity and quality
of the reviews available to potential end consumers, and to push such reviews back out to all the applications in our PowerListings Network.
- •
- As new platforms such as Snapchat and Uber have emerged, we have created capabilities to allow our customers to manage their
digital knowledge on those services, resulting in superior experiences for the end consumer. For example, companies can use the digital knowledge stored in our Knowledge Engine to set up Snapchat
Geofilter campaigns, allowing consumers to tag their business locations in Snaps with engaging images. Our integration with Uber enables businesses to embed links that allow Uber to pick up passengers
and also allows for
78
Table of Contents
Our Market Opportunity
We believe there is a large market opportunity created by the fundamental transformation in mobile search, digital marketing and digital
knowledge management. According to an October 2016 report by BIA/Kelsey, a market research firm, U.S. online and digital local advertising revenue is estimated to be over $50 billion annually.
We believe that our existing solution addresses a significant and critical subset of this market.
As
a subset of digital knowledge, we estimate that there are currently over 100 million potential business locations and points of interest in the world that could benefit from
our platform based on data from Google Maps. By multiplying those potential locations by an estimated annual revenue per location of $100, which is substantially less than our consolidated average
revenue per location based on our total revenue in fiscal 2017 divided by worldwide locations managed as of January 31, 2017, we estimate a total addressable market of approximately
$10 billion in 2017. This estimate does not include other opportunities such as professional service providers located in multiple locations, locations that have multiple service providers,
product information, events and reviews. Our estimate however is subject to risks and uncertainties as described in "Risk Factors—Risks Related to Our Business and
Industry—If the assumptions we use to estimate the size of our total addressable market are inaccurate, our future growth may be affected."
Growth Strategy
Key elements of our strategy include:
- •
- Grow our Customer Base. We
believe that there is a substantial opportunity to continue to increase the size of our customer base across a broad range of industries and companies, and to include more professional service
providers, such as individual doctors, insurance agents and financial services professionals, in addition to businesses. We plan to continue to invest in our direct sales force to grow our customer
base, both domestically and internationally.
- •
- Continue to Enter Attractive Industry
Verticals. We will continue our go-to-market strategy to further address specific industry verticals. We have deployed this strategy in the
financial services and healthcare sectors, and we plan to continue to expand into new verticals. For example, in the healthcare sector, we believe that there is a significant need for a solution such
as ours. Hospitals need to provide their patients with accurate digital knowledge regarding the details for their facilities, such as the exact location of the emergency room entrance. Individual
doctors need to
79
Table of Contents
provide
potential patients with their credentials and contact information. We already have several healthcare-specific participants in our PowerListings Network, such as Vitals and Wellness.com, that
are increasingly using healthcare-specific digital knowledge such as location and location-related data. The flexibility of our platform allows us to develop data schemas and objects that are tailored
to these needs.
- •
- Expand Existing Customer
Relationships. We plan to expand our relationships with existing customers. For example, some businesses may initially purchase our solution only
for their business in a particular country. By increasing their adoption of our solutions, we are able to increase the number of locations and digital knowledge available on our Knowledge Engine
platform. We also plan to up-sell additional features such as Pages and Reviews to existing customers, who generally start with our entry-level Listings feature.
- •
- Expand Internationally. We
believe that we have a significant opportunity to expand the use of our software outside the United States. Our platform supports over 90 languages and dialects and is integrated with applications
available in over 160 countries. We derived more than 6% of our revenues from non-U.S. sales in the fiscal year ended January 31, 2017, and we believe that there are substantial opportunities
to increase sales to customers outside of the United States as well as to help our existing U.S.-based customers manage data for more of their international business. We have an established presence
in the United Kingdom and we intend to further expand our footprint in Europe and other regions.
- •
- Develop and Market New Products and
Features. We are committed to developing and marketing innovative product capabilities to meet our customers' digital knowledge management needs.
We initially created and developed our platform around our Listings feature in 2011, allowing businesses to be found virtually everywhere that consumers search. In 2014, we added Pages as a new
feature, which enables customers to create individual pages that can be pushed to the top of local search results. In 2016, we launched Reviews, which allows our customers to encourage and facilitate
end consumer reviews, respond to reviews efficiently and integrate such reviews into the platforms of our PowerListings Network. We will continue to invest in further development of our platform and
product features to help our customers better manage their digital knowledge.
- •
- Extend the PowerListings
Network. We plan to continue to expand our PowerListings Network. We are increasing our focus on adding more industry vertical and international
services and applications to our network as well as including new services and applications that may become more commonly used in the future.
- •
- Expand Our Developer
Platform. We have recently opened up our Knowledge Engine to developers with the introduction of our Yext/Developer platform. Yext/Developer
offers our customers the ability to integrate into other systems to give our customers programmatic control of their organization's digital knowledge. For example, with our pre-built APIs, our
customers can ensure that their point-of-sale systems automatically learn of the address for a new store that is opened or that their customer support representatives are automatically notified of a
new review posted on a member of our PowerListings Network. We believe that the introduction of our Yext/Developer platform will further expand the ways that our Knowledge Engine can be utilized and
increase customer retention.
The Yext Knowledge Engine
The Yext Knowledge Engine is our cloud-based software platform that powers our key capabilities allowing customers to manage their digital
knowledge—such as store hours, a new address or an important status update—manage the content of their local landing pages and manage their consumer reviews, all from a single
login.
80
Table of Contents
We
offer a multi-tiered approach to our capabilities that starts with basic access to the Knowledge Engine and successively includes access to additional capabilities, with and without
our Pages feature. The current features of our packages are as follows:
Packages Without Pages
Packages With Pages
81
Table of Contents
Many of our customers initially deploy a Starter or Professional subscription to control and manage their digital knowledge using the Listings feature. Some
customers start with the Base subscription if they only need internal management of digital knowledge. As customers realize the benefits of our platform, many have increased or expanded their existing
subscription levels to obtain greater access to our key features, such as Reviews and Pages, as they need them.
Features of the Yext Knowledge Engine
Our scalable, cloud-based platform encompasses the following features:
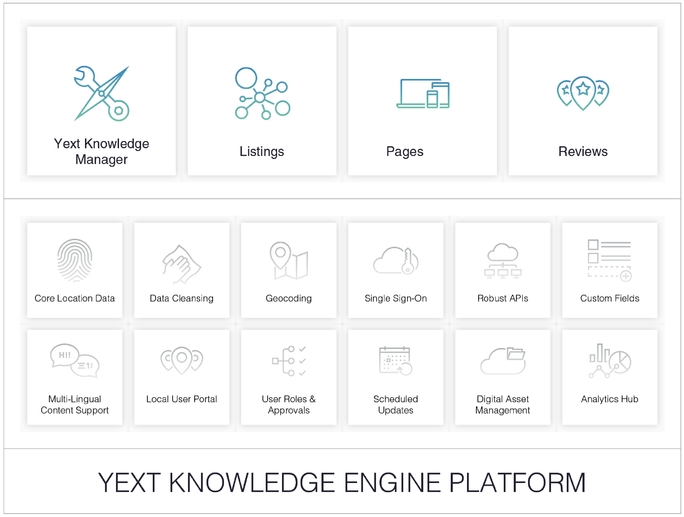
The
Yext Knowledge Manager is the user interface through which our customers access our features and the broad capabilities of our platform. It enables customers to centralize, control
and manage more than 100 data fields, including name, address and phone number, map marker, holiday hours, location-specific promotions, photo and video content and social links.
82
Table of Contents
Listings
The following shows a typical dashboard for a Listings subscriber:

Our
Listings feature allows our customers to claim and lock digital knowledge specific to location data so that updates are controlled through our platform, and then sync and update the
content across our PowerListings Network. Listings also enables the suppression of duplicate listings, as well as the implementation of real-time or near-real-time and scheduled updates of our
customers' data.
Our
PowerListings Network is comprised of over 100 applications across the globe, including major search engines, such as Bing and Google; social apps, such as Facebook and Instagram;
local service sites, such as Yelp; and mapping apps, such as Apple Maps and Google Maps. We have direct application program interface, or API, integrations with a number of these PowerListings Network
applications. As a result, our customers are able to control and update their business listings across all of these applications through our integrated platform with a single click.
Listings
also provides analytics support to keep our customers informed of how their public presence across the PowerListings Network is impacting their business, including visibility
into how often their listings are appearing in search results and how many people are clicking from those search results to learn more. Additionally, Listings enables our customers to manage their
brand content across all of their business listings to ensure a consistent message regardless of city, country or language.
83
Table of Contents
Pages
The following shows a typical dashboard for a Pages subscriber:
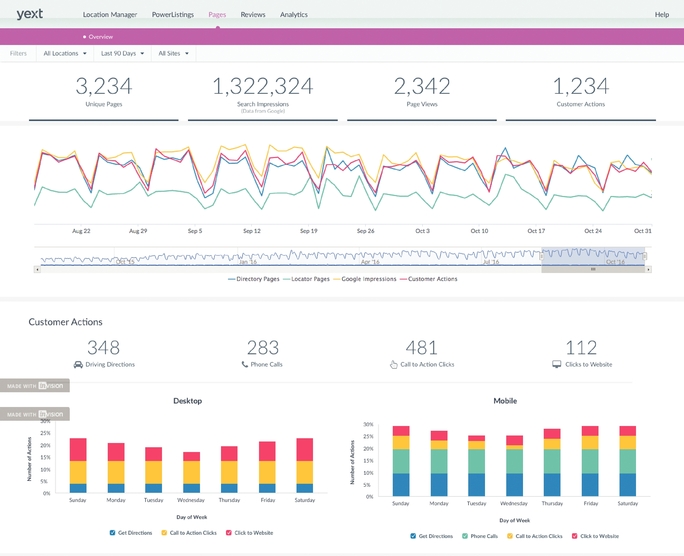
Our
Pages feature allows customers to establish specialized landing pages for their business, such as separate pages for each store, insurance agent or doctor's office, on their own
websites and to manage
rich and compelling digital content on those sites, including calls to action. Pages are automatically updated when the customer makes changes to the content linked to our Knowledge Engine, creating a
unique, dynamic web presence for every page.
Pages
are built with search engine optimization, or SEO, best practices, a fully configurable URL scheme and a consistent cross-device experience to assist our customers' stores, agents,
offices or service centers to increase their websites' search engine visibility and traffic.
Our
Pages feature has the functionality to automatically display our customers' most convenient location to consumers who are searching, enabling the filtering and refinement of searches
on websites by address, zip code, landmark, service and more. Additionally, Pages enhances the visibility of our customers' websites by categorizing their businesses based on the product lines or
services that they offer and supports multi-lingual content storage, allowing our customers to provide targeted content to their prospective end consumers and to organize digital knowledge so that
consumers and search engines are able to more easily locate the information they are searching for.
84
Table of Contents
Reviews
The following shows a typical dashboard for a Reviews subscriber:
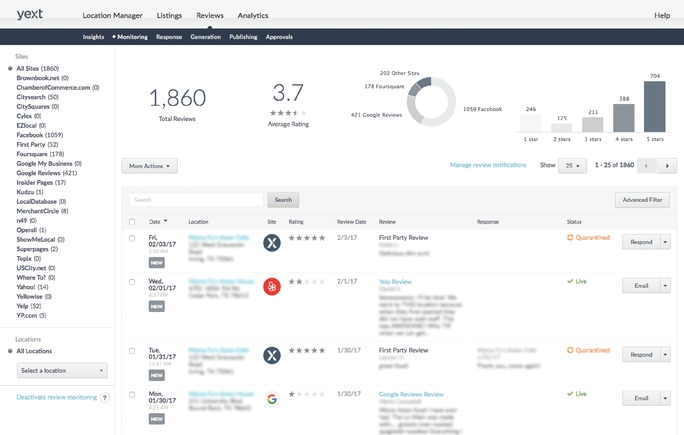
Our
Reviews feature enables customers to encourage and facilitate reviews from their end consumer, thereby increasing the quantity and quality of the reviews available to potential
consumers, the tools to manage their reviews from multiple sources from a single location and the ability to help strengthen their reviews across our PowerListings Network.
Our
Review Publishing platform utilizes SEO best practices, enhancing the visibility of the customer reviews. Additionally, our Review Quarantine feature allows our customers to hold
their customer reviews for up to seven days before they go live, permitting our customers to address authentic but negative feedback before it becomes public and automatically flags inauthentic or
inappropriate reviews for removal.
Our
Reviews feature also leverages our direct integrations with sites across the PowerListings Network to pull all of our customers' reviews, from every location managed on our platform,
into a single dashboard so that our customers can stay informed in an efficient manner. It also has functionality to alert our customers with a notification once new reviews become available and
provides a platform for our customer to respond to reviews and engage with their customers directly from the Yext Knowledge Engine. Reviews also allows our customers to view and generate reports that
display metrics of their ratings and reviews, based upon location, website or service and other factors.
85
Table of Contents
Key Additional Features of the Yext Knowledge Engine
Although our Knowledge Engine is used most heavily to support our primary Listings, Pages and Reviews features, the platform also provides our
customers with a number of additional key features and benefits including:
- •
- Core Location. Our Knowledge
Engine is our customers' centralized hub for all the data that defines their stores, offices, physicians, branches, ATMs, agents, dealerships, restaurants or service centers. Purpose-built for
managing attributes related to locations, the Knowledge Engine supports more than 50 standard fields, from address and phone number to payment methods, search categories, holiday hours, product
and menu lists and location-specific offers. Editing data, in bulk or for individual locations, is easy.
- •
- Geocoding and Data
Cleansing. Upon implementation, all of our customers benefit from our rigorous data cleansing process to help ensure their data is formatted
consistently and completely, whether they have two or 20,000 business locations and any number of attributes. Our operations team reviews data to detect inconsistencies, discrepancies, and
missing fields. We help our customers ensure that their data is correct and complete, and we work with them to find the best way to fill any gaps we find. As part of our rigorous data cleansing
process, we verify all customers' coordinates with some of the largest mapping providers in the PowerListings Network—including Google Maps and Bing—so that customers' map pins
appear correctly to both drivers and pedestrians.
- •
- Single Sign-On. In our
user-friendly Partner Portal, customers can take bulk actions as needed, including uploading, editing and exporting, as well as creating social posts for all managed locations and moving multiple
managed locations to a folder.
- •
- APIs. Our low-latency APIs make
it easy for customers to ensure that all of their internal systems work consistently when connecting with the Knowledge Engine.
- •
- Custom Fields. Custom fields make
it easy for our customers to extend their existing data model to our Knowledge Engine. We work with our customers to define the custom fields that represent their data management strategy best, like
brand, open status or square footage. Customers can add custom fields that support URLs, photos, yes/no answers or 12 additional data validation types to manage their location and other related data
on their own terms.
- •
- Multilingual Content
Support. Our Multi-Language Data Storage allows our customers to present a tailored experience to diverse consumers locally and worldwide while
maintaining data consistency, avoiding discrepancies and satisfying local customers. Additionally, our industry expertise and direct PowerListings Network relationships support our customers' global
scale and expansion with smart, pre-formatted addresses, phone numbers and payment options for over 160 countries and over 90 languages and dialects.
- •
- Local User Portal. Our
customizable and extensible Local User Portal delivers a branded experience to franchisees, agents or advisors, giving local managers an active role in managing the digital knowledge that consumers
seek while maintaining brand compliance.
- •
- User Roles and Approval
Workflows. Our flexible, scalable user roles, workflows and approvals give our customers the option to allow franchisees or local managers to
manage data for their business locations while letting corporate management maintain total brand control. Management can empower franchisees or local managers to contribute key data about their
individual properties that give their online presence a personal touch, including hours of operation, photos and local specials. Our flexible workflows support the processes and controls of business
so managers can give individuals users, such as their employees, franchisees or local or regional managers, as much or as little responsibility as they would like. Those users can request edits to any
data field, while approvers can review requested changes, accept, reject or reassign those changes, and explain their decisions to those who made the request. Our Smart Notifications make it easy to
comply and collaborate.
86
Table of Contents
- •
- Scheduled Content and Digital Asset
Management. Changes to digital knowledge, from holiday hours to featured promotions to social posts, can be scheduled to post automatically on
the dates desired. Our customers are able to view all the locations that leverage a digital asset such as a photo, video or text, in order to keep track of where and when photos and offers appear to
consumers.
- •
- Analytics Hub. Analytics keep
our customers informed of how their public presence across services drives business for their brands. For example, customers can view how often their listings appear in search, how many people click
from those search results to learn more, the terms for which their individual business locations appear to consumers and favorite Instagram hashtags to post from those locations. Via our direct
integrations with applications in the PowerListings Network, customers control the URL that their listings drive to, so they can tie their listings back to the conversion metric of their choice.
Our Technology
Our cloud-based software platform is designed to scale as we continue to add customers and allows us to support digital knowledge for millions
of attributes and locations. The platform is built primarily with industry-standard open source technology. We use a microservices-based architecture to maximize the manageability, flexibility and
scalability of our software as it continues to grow more complex. We also employ a modern continuous delivery approach to building, testing and deploying our software.
Hosting
The majority of our customer-facing software is run from two co-location data centers. To provide the highest level of up-time and lowest
latency for our platform capabilities, key high-volume services are hosted by third-party hosting services, which allows easier and greater scalability and provides for redundancy.
Data Structure
Our Yext Knowledge Engine allows customers to collect, store and manage structured data, consistent with standards published by schema.org.
Schema.org is an open and collaborative initiative launched by certain large search engines that defines the vocabulary and format for structured markup. Search engines like Google and Bing consume
local data through structured markup placed in the underlying code of web pages.
We
actively monitor and track the schema.org standards so that our Yext Knowledge Engine stores and publishes data in accordance with the most current schema.org specifications.
Interfaces with our PowerListings Network
We rely on integrations with each of the applications in our PowerListings Network that enable us to accomplish some or all of the following key
tasks with members of our PowerListings Network:
- •
- search for existing listings and retrieve details about them, in order to match our customers' digital knowledge to existing listing data;
- •
- claim listings and deliver updated digital knowledge content;
- •
- retrieve or get notified about reviews and allow review response; and
- •
- obtain statistics about traffic on listings to display to our customers in the platform.
Over
the years, we have developed special integrations with a number of the applications in our PowerListings Network. We have also worked with the major application providers in the
PowerListings Network to develop trust and strong working relationships, resulting in specific operational workflows, processes for issue resolution, and specialized technology and processes tailored
to the nuances of each.
87
Table of Contents
For
smaller PowerListings Network application providers, we have developed our own API specifications that each provider builds and implements for integration with our Yext Knowledge Engine.
Our Customers
As of January 31, 2017, we served nearly 40,000 businesses with locations in over 100 countries. These include many leading businesses in
a diverse set of industries, such as healthcare and pharmaceuticals, retail, financial services, manufacturing and technology. For this purpose, we define a customer as a separate and distinct buying
entity, such as a company, a government institution, a franchisor, a service provider or agency or a distinct business unit of a large corporation that has an active contract directly with us.
These
include:
|
|
|
|
|
|
|
|
|
|
|
Financial Services
|
|
Healthcare |
|
Hospitality, Food & Beverage |
|
Retail |
| BMO Harris Bank |
|
Steward Health Care |
|
Arby's |
|
Marriott |
|
AutoZone |
|
Michael's |
Citi
Farmers Insurance Group
H&R Block |
|
Hospital Corporation of
America (HCA)
Fresenius Medical Care North
America (FMCNA) |
|
Ben & Jerry's
Denny's
Huddle House |
|
McDonald's
Premier Inn
Sonic Drive-In |
|
Best Buy
Cole Haan
David's Bridal
Home Depot
Infiniti |
|
NAPA Auto
Parts
Rite Aid
rue21
T-Mobile |
One
reseller customer, Dex Media, accounted for 12% and 10% of our revenues for the fiscal years ended January 31, 2015 and 2016, respectively. No single customer represented more
than 10% of our revenues for the fiscal year ended January 31, 2017.
Customer Case Studies
Denny's, Inc.
Denny's is a global restaurant chain with over 1,700 franchise locations worldwide and approximately 240 franchisees. Denny's
wanted to enhance its digital presence to serve mobile-empowered consumers of all ages, to win and keep brand awareness and customer loyalty. Denny's initially used our Listings solution to gain full
control of its presence on local listing sites and to update location data and enhanced content like menus, photos, events, attributes, videos, brands carried and amenities available at the franchise
location level, all in both English and Spanish. With Listings, Denny's can immediately update listings for one location or all of its locations from a comprehensive dashboard display. Soon after
implementing Listings, Denny's added our Pages solution to optimize its local mobile web pages and campaigns. Following implementation of Pages, Denny's reports that its store location pages
experienced a 35% increase in search traffic in less than a year after launching Pages.
Denny's
also uses Reviews to manage its location reviews across sources including Google, Yelp, Facebook and other applications to make it easier to encourage customers to review
restaurants, providing credibility and visibility in search. After using Reviews for two months, Denny's first-party reviews, which are the reviews submitted directly to location pages with the star
rating integrated into our PowerListings Network, beat the rating of 3.5 (out of 5) directly submitted on third-party sites by over a full point.
Steward Health Care
Steward Health Care is a community-based health care organization with 10 hospital campuses and 24 affiliated urgent care provider
locations providing access to 3,000 primary care and specialist physicians for 3 million patients per year. Steward needed a tool to help manage its constantly changing physician and location
information. Our Knowledge Engine enabled Steward to manage and update location and physician data for every local practice—including National Provider Identifier, specialties, headshots,
qualifications and experiences, languages spoken, hospital affiliations, provider bios, procedures performed and other healthcare-specific data, all from a single comprehensive dashboard. Steward now
has 150 of its practices, over 750 physicians and all 10 hospital campuses live on our Knowledge Engine,
88
Table of Contents
which
create a total of 60,000 live listings across our PowerListings Network sourcing from our Knowledge Engine. Following its implementation of our platform, Steward reported that it experienced a
40% increase in search impressions for physicians and a 44% increase in doctor profile views in the five months subsequent. Steward improved the accuracy and consistency of listings, correcting over
58,000 addresses, over 49,000 phone numbers and over 123,000 website URLs across the PowerListings Network from previously published data.
Premier Inn
With over 700 locations and more than 60,000 rooms, Premier Inn is the United Kingdom's largest hotel chain. Premier Inn realized that their
digital presence was lacking beyond Google search, and that they needed a solution that would allow them to efficiently manage their location and other related data—including an email
address for the on-site contact, associations and awards—across multiple applications.
Premier
Inn initially launched 350 of its U.K. locations with Listings. Premier Inn also uses Reviews to monitor reviews in real time across social sites like Facebook and Yelp to
preserve its brand reputation and monitor customer satisfaction. With Reviews, Premier Inn's marketing team and local hotel managers can easily monitor their customers' social engagement and they can
respond directly from the platform. This was important because overseas travelers rely heavily on reviews to influence their decisions to book hotels. In the first three months after implementing our
platform, Premier Inn reports that it added 55% net new listings. Prior to using our platform, an estimated 73% of addresses for their locations included errors, and we updated 16,539 addresses across
our PowerListings Network to correct those errors. Premier also added over 16,000 website URLs, 100,000 logos and photos and 26,000 business descriptions to its presence online with our solutions
across our PowerListings Network.
Our PowerListings Network
As of January 31, 2017, our PowerListings Network included more than 100 service and application providers. Our PowerListings network
includes leading directories, mobile maps, search engines and social apps. These include:
|
|
|
|
|
|
|
| Mobile Maps |
|
Search Engines |
|
Social |
|
Directories |
| Apple Maps |
|
Bing |
|
Facebook |
|
AllMenus |
| Google Maps |
|
Google |
|
Foursquare |
|
Citysearch |
| HERE Maps |
|
Yahoo! |
|
Google |
|
Local.com |
| MapQuest |
|
|
|
Instagram |
|
WhitePages |
| TomTom |
|
|
|
Yelp |
|
YellowPages |
Sales and Marketing
We sell our solution globally to customers of all sizes, from one location to thousands of locations, through direct sales efforts to our
customers, including third-party resellers, and through a self-service purchase process. Most of our resellers serve small business customers or non-U.S. customers, while we serve the significant
majority of enterprise and mid-size business customers through our direct sales force. In transactions with resellers, we are only party to the transaction with the reseller and are not a party to the
reseller's transaction with its customer.
Our
sales organization varies by market within each country and will change over time as we build critical mass and address various vertical segments within a market. As of
January 31, 2017, we had
106 members of our direct sales team and more than 3,500 resellers. We plan to continue to grow our sales and marketing organization as we expand globally.
89
Table of Contents
Customer Support and Professional Services
Our account services team provides customer support for each of our customers. Support begins in the customer acquisition phase and continues
throughout the duration of the relationship. Customer support includes working with customers on launch and on-boarding, ongoing support, assessment of solution and feature mix, analytics and renewal.
We also have a dedicated professional services team. This team provides support to customers that require custom development services, may have special operational needs or may require more custom
analytics.
Research and Development
As of January 31, 2017, our research and development organization had 83 employees. Our global research and development organization uses
and shares the same technology, platform development tools and data across various sites. Our research and development expenses were $11.9 million, $16.2 million and $19.3 million
for the fiscal years ended January 31, 2015, 2016 and 2017, respectively.
Intellectual Property
Our intellectual property is an essential element of our business. We rely on a combination of patent, trade secret, trademark, copyright and
other intellectual property laws, confidentiality agreements and license agreements to protect our intellectual property rights. We also license certain third-party technology for use in conjunction
with our platform.
We
believe that our continued success depends on hiring and retaining highly capable and innovative employees, especially as it relates to our engineering base. It is our policy that our
employees and independent contractors involved in development are required to sign agreements acknowledging that all inventions, trade secrets, works of authorship, developments and other processes
generated by them on our behalf are our property and assigning to us any ownership that they may claim in those works. Despite our precautions, it may be possible for third parties to obtain and use
without consent intellectual property that we own or license. Unauthorized use of our intellectual property by third parties, and the expenses incurred in protecting our intellectual property rights,
may adversely affect our business.
Patents and Patent Applications
As of January 31, 2017, we had eight issued U.S. patents, five non-provisional and two provisional U.S. patent applications and four
international Patent Cooperation Treaty patent applications pending. The issued patents have expiration dates ranging from 2032 to 2035. Although we actively attempt to utilize patents to protect our
technologies, we believe that none of our patents, individually or in the aggregate, are material to our business. We will continue to file and prosecute patent applications when appropriate to
attempt to protect our rights in our proprietary technologies. However, there can be no assurance that our patent applications will be approved, that any patents issued will adequately protect our
intellectual property, or that such patents will not be challenged by third parties or found by a judicial authority to be invalid or unenforceable.
Trademarks
We rely on registered and unregistered trademarks to protect our brand. As of January 31, 2017, we had 38 trademarks registered
globally. "Yext" and "PowerListings" are registered trademarks in the United States and in certain other countries.
Competition
The market for digital knowledge management, particularly for location and location-related data, is new and rapidly evolving, and we face many
competitors with a variety of product offerings. Our primary competition comes from businesses that choose to handle digital
knowledge management of their location and related data in-house using manual, paper and spreadsheet-based systems that corporate personnel
90
Table of Contents
employ
in a fragmented manner rather than pay for a third-party solution. In addition, some small companies may offer products and solutions at lower price points than us or that compete with some but
not all of the features present in our platform and solutions. Larger companies with substantial resources may also decide to enter the digital knowledge management business and create or acquire
products that are competitive to our platform. As we introduce new features and our existing platform evolves, or as other companies introduce new products and services, we may become subject to
additional competition.
We
believe that we generally compete favorably with our competitors because of the size and breadth of our integration and relationships with the applications in our PowerListings
Network, the features and performance of our platform and our various solutions, the ease of integration of our solutions with the technological infrastructures of our customers and the incremental
marketing benefits and return on investment that our various solutions offer to our customers.
Employees
As of January 31, 2017, we had over 630 full-time employees, the substantial majority of which were located in our New York
offices. We consider our culture and employees to be vital to our success. None of our domestic employees are represented by a labor union or covered by a collective bargaining agreement, although
works councils exist in various foreign jurisdictions where we have employees.
Facilities
Our worldwide corporate headquarters and executive offices are located in New York, New York, where we occupy approximately 95,000 square feet
of office space under a lease and a sublease that expire in December 2020. In addition to serving as our corporate headquarters, our New York offices also support our sales, marketing, research and
development and other general and administrative functions. We also have domestic offices in Tysons Corner, Virginia, Dallas, Texas and
Chicago, Illinois and an international office in London, United Kingdom. All of our facilities are leased. We believe that our existing facilities are adequate for our current needs and that suitable
additional or alternative space will be available on commercially reasonable terms if and when it becomes needed.
Legal Proceedings
We are a defendant in a case pending in the United States District Court for the Southern District of New York, captioned Tropical
Sails Corp. v. Yext, Inc., civil action no. 14-cv-7582. The plaintiffs allege various violations of New York law related to
certain of our sales practices. On May 18, 2015, the Court dismissed two of the four counts alleged by plaintiffs. On March 11, 2016, the plaintiffs filed a Motion for Class
Certification, and we filed a Motion for Summary Judgment as to the remaining counts. On March 17, 2017, the Court denied the plaintiffs' Motion for Class Certification and our Motion for
Summary Judgment. On April 11, 2017 we entered into a settlement agreement pursuant to which the case will be dismissed with prejudice.
In
addition, we are and may be involved in various legal proceedings arising from the normal course of business activities. Although the results of litigation and claims cannot be
predicted with certainty, currently, in our opinion, the likelihood of any material adverse impact on our consolidated results of operations, cash flows or our financial position for any such
litigation or claims is deemed to be remote. Regardless of the outcome, litigation can have an adverse impact on us because of defense costs, diversion of management resources and other factors.
91
Table of Contents
MANAGEMENT
Executive Officers and Directors
The following table sets forth certain information concerning our current executive officers and directors, including their ages as of
February 28, 2017:
|
|
|
|
|
|
|
Name
|
|
Position(s) |
|
Age |
|
Executive Officers: |
|
|
|
|
|
|
Howard Lerman |
|
Chief Executive Officer, Class I Director |
|
|
37 |
|
Brian Distelburger |
|
President, Class I Director |
|
|
38 |
|
Steven Cakebread |
|
Chief Financial Officer |
|
|
65 |
|
Tom Dixon |
|
Chief Technology Officer |
|
|
36 |
|
James Steele |
|
President and Chief Revenue Officer |
|
|
61 |
|
Non-Employee Directors: |
|
|
|
|
|
|
Michael Walrath(1)(2) |
|
Chairman and Class II Director |
|
|
41 |
|
Phillip Fernandez(1)(3) |
|
Class II Director |
|
|
56 |
|
Jesse Lipson(1) |
|
Class III Director |
|
|
39 |
|
Julie Richardson(3) |
|
Class I Director |
|
|
53 |
|
Andrew Sheehan(2)(3) |
|
Class III Director |
|
|
59 |
|
- (1)
- Member
of the compensation committee.
- (2)
- Member
of the nominating and governance committee.
- (3)
- Member
of the audit committee.
Executive Officers
Howard Lerman is our Co-Founder and Chief Executive Officer and has also served as a member
of
our Board of Directors since our inception in 2006. Prior to co-founding Yext, Mr. Lerman founded and served as a senior manager of several privately held software companies. Since 2014,
Mr. Lerman has also served as Co-Founder and Chairman of Confide, a privately held electronic messaging service. Mr. Lerman is a graduate of Thomas Jefferson High School for Science and
Technology and holds a B.A. in History from Duke University. Our Board of Directors believes that Mr. Lerman's knowledge of our company as a Co-Founder and as a thought leader in the digital
knowledge industry allows him to make valuable contributions to the Board of Directors.
Brian Distelburger is our Co-Founder and President and has also served as a member of our Board of Directors since our inception in 2006.
Prior to co-founding Yext, Mr. Distelburger founded and served as a senior manager of a privately held software company. From September 2012 until its sale in April 2016,
Mr. Distelburger also served as chairman of the board of directors of Food Genius, Inc., a privately held food service data provider. Mr. Distelburger also serves on the Cornell
Entrepreneurship Advisory Council. Mr. Distelburger holds a Bachelor's degree from Cornell University. Our Board of Directors believes that Mr. Distelburger's knowledge of our company as
a Co-Founder and as a thought leader in the digital knowledge industry allows him to make valuable contributions to the Board of Directors.
Steven Cakebread has served as our Chief Financial Officer since October 2014. Prior to joining Yext, Mr. Cakebread served in
various senior executive roles, including as Chief Financial Officer and Chief Accounting Officer of D-Wave Systems, a quantum computing company, from March 2013 to September 2014 and as Chief
Financial Officer of Pandora Media Inc., a provider of personalized internet radio and music discovery service, from March 2010 to December 2012. From 2009 to March 2010, Mr. Cakebread
was a Principal with J. Stevens & Co. LLC, a consulting company. From February 2009 to December 2009, Mr. Cakebread served as Senior Vice President, Chief Accounting
Officer and Chief Financial Officer of
92
Table of Contents
Xactly
Corporation, a provider of on-demand sales performance management software. Mr. Cakebread also served as President and Chief Strategy Officer of Salesforce, a customer relationship
management service provider, from March 2008 to February 2009, and as Chief Financial Officer of Salesforce from May 2002 to March 2008. Mr. Cakebread has served on the board of directors of
ServiceSource International, Inc., a publicly held revenue lifecycle management software company, since 2010. He previously served as a member of the boards of directors of Solar Winds from
January 2008 to
February 2016, Care.com from December 2013 to November 2014 and eHealth from June 2006 to June 2012. Mr. Cakebread holds a B.S. in Business from the University of California, Berkeley, and a
M.B.A. from Indiana University.
Tom Dixon has served as our Chief Technology Officer since February 2017 and served as our Chief Operating Officer from February 2010
until February 2017. Prior to joining Yext, Mr. Dixon co-founded several private software companies, including justatip.com and Intwine, and also served as the Chief Information Officer at
Datran Media following its acquisition by Intwine. Mr. Dixon holds a B.A. in Philosophy from Princeton University.
James Steele has served as our President and Chief Revenue Officer since January 2017. Mr. Steele joined our Board of Directors in
November 2016 and subsequently resigned from our Board of Directors in connection with his hiring in January 2017. Mr. Steele previously served as the President of InsideSales.com, a privately
held provider of sales acceleration platforms, from January 2015 until January 2017. Prior to that time, from 2002 to December 2014, Mr. Steele served in various positions at Salesforce,
including as the Chief Customer Officer and the President of Worldwide Sales, and before that he served in various management positions for more than 20 years at IBM, a technology and consulting
company. Mr. Steele has also served as a member of the board of directors of Instructure, a publicly held software company, since October 2016 and also served as a member of the board of directors of
IntraLinks Holdings, a publicly held software company, from September 2016 until its acquisition by Synchronoss Technologies in January 2017. Mr. Steele holds a B.S. in Civil Engineering from
Bucknell University.
Non-Employee Directors
Michael Walrath has served as the Chairman of our Board of Directors since March 2011 and
has
served as a director since November 2009. Mr. Walrath was the Founder and Chief Executive Officer of Right Media, an online advertising company, from January 2003 until its acquisition by
Yahoo! in 2007. Mr. Walrath sits on the boards of directors of a number of private software and media companies. Mr. Walrath holds a B.A. in English from the University of Richmond. Our
Board of Directors has determined that Mr. Walrath's extensive experience as an entrepreneur in the technology and advertising industries, as well as his experience leading and advising
high-growth companies, makes him a qualified member of our Board of Directors.
Phillip Fernandez has served as a director since October 2016. Mr. Fernandez co-founded Marketo, an engagement marketing company,
where he served as President, Chief Executive Officer and chairman of the board of directors from January 2006 until its acquisition by Vista Equity Partners in August 2016. In January 2017,
Mr. Fernandez joined Shasta Ventures as a Venture Partner. Mr. Fernandez has served as a member of the board of directors of PTC, a computer software company, since February 2016 and was
a member of the board of directors of TIBCO Software, a publicly held software company, from June 2014 to December 2014, when it was acquired by Vista Equity Partners.
Mr. Fernandez holds a B.A. in History from Stanford University. Our Board of Directors has determined that Mr. Fernandez's extensive experience as a chief executive officer of a publicly
traded marketing technology company makes him a qualified member of our Board of Directors.
Jesse Lipson has served as a director since August 2012. Mr. Lipson has served as Corporate Vice President and General Manager of
Cloud Services at Citrix, a network software company, since January 2016. Prior to that time, Mr. Lipson was Chief Executive Officer of ShareFile, a network software
93
Table of Contents
company,
from 2005 to 2011, when it was acquired by Citrix. Mr. Lipson held various leadership positions with Citrix between October 2011 and his appointment as Corporate Vice President and
General Manager of Cloud Services in January 2016. Mr. Lipson holds a B.A. in Philosophy from Duke University. Our Board of Directors has determined that Mr. Lipson's extensive
experience as an entrepreneur in the technology industry makes him a qualified member of our Board of Directors.
Julie Richardson has served as a director since May 2015. From November 2012 to October 2014, Ms. Richardson was a Senior Adviser
to Providence Equity Partners LLC, a global asset management firm. From April 2003 to November 2012, Ms. Richardson was a Partner and managing director at Providence Equity, a private
equity investment fund, and oversaw its New York office. Prior to Providence Equity, Ms. Richardson served as Global Head of JP Morgan's Telecom, Media and Technology Group, and was previously
a managing director in Merrill Lynch & Co.'s investment banking group. Ms. Richardson has served on the board of directors of The Hartford Financial Group, a publicly held
insurance and financial services company, since January 2014, VEREIT, a publicly held real estate investment operating property company, since April 2015, and Arconic, a publicly held materials
manufacturing company, since November 2016. Ms. Richardson previously served on the board of directors of Stream Global Services, Inc. from 2009 to 2012. Ms. Richardson holds a
B.B.A from the University of Wisconsin-Madison. Our Board of Directors has determined that Ms. Richardson's financial skills and investment management and financial services experience make her
a qualified member of our Board of Directors.
Andrew Sheehan has served as a director since May 2008. Mr. Sheehan has been a managing director at Sutter Hill Ventures, a venture
capital firm, since 2007. Mr. Sheehan has also been a managing director of Tippet Venture Partners, L.P., a venture capital firm, since 2014. Mr. Sheehan has served on the board
of directors of Quinstreet, a publicly held marketing technology company, since February 2017. Mr. Sheehan also serves on the boards of directors of a number of private companies in the technology
industry. Mr. Sheehan holds a B.A. in English from Dartmouth College and a M.B.A. from the University of Pennsylvania Wharton School. Our Board of Directors has determined that
Mr. Sheehan's leadership experience, expertise as a venture capital investor and knowledge regarding the technology industry make him a qualified member of our Board of Directors.
Board Composition
Our directors are divided into three classes serving staggered three-year terms. Class I, Class II and Class III directors
will serve until our annual meetings of stockholders in 2018, 2019 and 2020, respectively. Upon expiration of the term of a class of directors, directors in that class will be eligible to be elected
for a new three-year term at the annual meeting of stockholders in the year in which their term expires. As a result of this classification of directors, it generally takes at least two annual
meetings of stockholders for stockholders to effect a change in a majority of the members of our Board of Directors.
Our
Board of Directors currently consists of seven members. Messrs. Distelburger and Lerman and Ms. Richardson are Class I directors and will serve until our annual
meeting of stockholders in 2018. Messrs. Fernandez and Walrath are Class II directors and will serve until our annual meeting of stockholders in 2019. Messrs. Lipson and Sheehan
are Class III directors and will serve until our annual meeting of stockholders in 2020.
Director Independence
Upon the completion of this offering, our common stock will be listed on the New York Stock Exchange, or NYSE. Under the rules of the NYSE,
independent directors must comprise a majority of a listed company's board of directors within a specified period after completion of this offering. In addition, the rules of the NYSE require that,
subject to specified exceptions, each member of a listed company's audit, compensation and nominating and governance committees be independent. Audit committee members must also satisfy the
independence criteria set forth in Rule 10A-3 under the Securities Exchange
94
Table of Contents
Act
of 1934, as amended, or the Exchange Act. Under the rules of the NYSE, a director will only qualify as an "independent director" if, in the opinion of that company's board of directors, that
person does not have a relationship that would interfere with the exercise of independent judgment in carrying out the responsibilities of a director.
Our
Board of Directors has undertaken a review of its composition, the composition of its committees and the independence of each director. Our Board of Directors has determined that
Messrs. Fernandez, Lipson, Sheehan and Walrath and Ms. Richardson do not have a relationship that would interfere with the exercise of independent judgment in carrying out the
responsibilities of a director and that each is "independent" as that term is defined under the applicable rules and regulations of the SEC and the NYSE. Accordingly, a majority of our directors are
independent, as required under applicable NYSE rules. In making this determination, our Board of Directors considered the current and prior relationships that each non-employee director has with our
company and all other facts and circumstances our Board of Directors deemed relevant in determining their independence, including the beneficial ownership of our capital stock by each non-employee
director.
Board Committees
Our Board of Directors has established an audit committee, a compensation committee and a nominating and corporate governance committee.
Audit Committee
Our audit committee consists of Messrs. Fernandez and Sheehan and Ms. Richardson, with Ms. Richardson serving as chairman.
We believe that our audit committee members meet the requirements for financial literacy under the current requirements of the Sarbanes-Oxley Act of 2002, the NYSE listing standards and SEC rules and
regulations. In addition, our Board of Directors has determined that Ms. Richardson is an audit committee financial expert within the meaning of SEC regulations. We have made this determination
based on information received by our Board of Directors, including questionnaires provided by the members of our audit committee.
In
order to be considered to be independent for purposes of Rule 10A-3(b)(1) under the Exchange Act, a member of an audit committee of a listed company may not, other than in his
or her capacity as a member of the audit committee, the board of directors, or any other board committee: (1) accept, directly or indirectly, any consulting, advisory, or other compensatory fee
from the listed company or any of its subsidiaries; or (2) be an affiliated person of the listed company or any of its subsidiaries. Each member of our audit committee satisfies the
independence requirements under the NYSE listing standards and Rule 10A-3(b)(1) of the Exchange Act.
Our
audit committee's duties and responsibilities are to, among other things:
- •
- appoint and oversee an independent registered public accounting firm and approve audit and non-audit services;
- •
- evaluate the independence and qualifications of the independent registered public accounting firm at least annually;
- •
- review our annual audited consolidated financial statements and quarterly consolidated financial statements;
- •
- review the responsibilities, functions, qualifications and performance of our internal audit function, including our internal audit function's
charter, plans, budget, objectivity and the scope and results of internal audits;
- •
- approve the hiring, promotion, demotion or termination of the person in charge of our internal audit function;
95
Table of Contents
- •
- review the results of the internal audit program, including significant issues in internal audit reports and responses by management;
- •
- review the hiring of employees or former employees of our independent registered public accounting firm;
- •
- review, approve and monitor related party transactions involving directors or executive officers and review and monitor conflicts of interest
situations involving such individuals where appropriate;
- •
- periodically, meet separately with management, the internal auditors and our independent registered public accounting firm, both with and
without management present, in each case to discuss any matters that the audit committee or others believe should be discussed privately;
- •
- address complaints we receive regarding accounting, internal accounting controls or auditing matters and procedures for the confidential,
anonymous submission by our employees of concerns regarding questionable accounting or auditing matters;
- •
- review and discuss with management and our independent registered public accounting firm, on at least an annual basis, the overall adequacy and
effectiveness of our legal, regulatory and ethical compliance programs, as well as reports regarding compliance with applicable laws, regulations and internal compliance programs;
- •
- discuss with management and our independent registered public accounting firm any correspondence with regulators or governmental agencies and
any published reports that raise material issues regarding our financial statements or policies and discuss with our chief financial officer or senior legal officer any legal matters that may have a
material impact on the financial statements or our compliance procedures;
- •
- discuss with management and, as appropriate, our independent registered public accounting firm, the adequacy and effectiveness of our policies
and practices regarding information technology risk management and the internal controls related to cybersecurity;
- •
- report regularly to the Board of Directors about issues including, but not limited to, any issues that arise with respect to the quality or
integrity of our financial statements, our compliance with legal or regulatory requirements, the performance and independence of the independent registered public accounting firm and, when the
internal audit function is established, the performance of the internal audit function;
- •
- review at least annually the adequacy of the committee's charter and recommend any proposed changes to the Board of Directors for approval; and
- •
- conduct and present to the Board of Directors an annual self-performance evaluation of the committee.
Our
audit committee operates under a written charter that satisfies the applicable rules of the SEC and the listing standards of the NYSE.
Compensation Committee
Our compensation committee consists of Messrs. Fernandez, Lipson and Walrath, with Mr. Fernandez serving as chairman. Each member
of the compensation committee meets the requirements for independence under, and the functioning of our compensation committee complies with, any applicable requirements of the Sarbanes-Oxley Act, the
NYSE listing standards and SEC rules and regulations. Additionally, each member of the compensation committee is a "non-employee director" as defined in Rule 16b-3 promulgated under the
Exchange Act and is an "outside director" as defined in Section 162(m)
96
Table of Contents
of
the Internal Revenue Code of 1986, or the Code. Our compensation committee's duties and responsibilities are to, among other things:
- •
- establish, and periodically review, a general compensation strategy for our company, and oversee the development and implementation of our
compensation plans to ensure that these plans are consistent with this general compensation strategy;
- •
- administer all of our equity-based plans and such other plans as shall be designated from time to time by the Board of Directors;
- •
- review, approve and determine, or make recommendations to our Board of Directors regarding, the compensation of our executive officers;
- •
- review and recommend to the Board of Directors the form and amount of compensation, including perquisites and other benefits, and any
additional compensation to be paid, for service on the Board and Board committees and for service as a chairperson of a Board committee;
- •
- oversee regulatory compliance with respect to compensation matters affecting us;
- •
- retain or obtain the advice of compensation consultants, independent legal counsel and other advisers;
- •
- review and discuss with management the compensation discussion and analysis that we may be required to include in SEC filings from time to
time;
- •
- prepare the compensation committee report on executive compensation that may be required by the SEC from time to time to be included in our
annual proxy statements or annual reports on Form 10-K filed with the SEC;
- •
- conduct and present to the Board of Directors an annual self-performance evaluation of the committee; and
- •
- review at least annually the adequacy of the committee's charter and recommend any proposed changes to the Board of Directors for approval.
Our
compensation committee operates under a written charter that satisfies the applicable rules of the SEC and the listing standards of the NYSE.
Nominating and Corporate Governance Committee
Our nominating and corporate governance committee consists of Messrs. Sheehan and Walrath, with Mr. Sheehan serving as chairman.
Each member of the nominating and corporate governance committee meets the requirements for independence under, and the functioning of our nominating and corporate governance committee complies with,
any applicable requirements of the Sarbanes-Oxley Act, the NYSE listing standards and SEC rules and regulations. Our nominating and governance committee's duties and responsibilities are to, among
other things:
- •
- make recommendations to the Board of Directors regarding the size and structure of the board, the composition of the board, the criteria for
board membership and the process for filling vacancies on the board;
- •
- identify individuals qualified to become board members, after taking into consideration, if applicable, the criteria for board membership. and
recommend to the Board of Directors nominees to fill vacancies and newly created directorships and the nominees to stand for election as directors;
- •
- review the duties, composition and charters of the committees of the Board of Directors;
- •
- review and recommend to the Board of Directors our corporate governance principles and any proposed changes to such principles;
97
Table of Contents
- •
- conduct and present to the Board of Directors an annual self-performance evaluation of the committee;
- •
- oversee the evaluation of the Board of Directors, its committees and management and report such evaluation to the Board of Directors;
- •
- review and approve our Code of Business Conduct and Ethics, consider questions of possible conflicts of interest of board members and other
corporate officers, review actual and potential conflicts of interest of board members and corporate officers, other than related party transactions reviewed by the audit committee, and approve or
prohibit any involvement of such persons in matters that may involve a conflict of interest or taking of a corporate opportunity; and
- •
- review at least annually the adequacy of the committee's charter and recommend any proposed changes to the Board of Directors for approval.
Our
nominating and governance committee operates under a written charter that satisfies the applicable listing requirements and rules of the NYSE.
Code of Business Conduct and Ethics
Our Board of Directors has adopted a Code of Business Conduct and Ethics, which establishes the standards of ethical conduct applicable to all
directors, officers and employees of our company. The code addresses, among other things, conflicts of interest, compliance with disclosure controls and procedures and internal controls over financial
reporting, corporate opportunities and confidentiality requirements. Upon completion of this offering, our Code of Business Conduct and Ethics will be available on our website at www.yext.com. We
intend to disclose any amendments to the code, or any waivers of its requirements, on our website to the extent required by SEC applicable rules and regulations. The inclusion of our website address
in this prospectus does not include or incorporate by reference into this prospectus the information on or accessible through our website.
Compensation Committee Interlocks and Insider Participation
None of the members of our compensation committee is an executive officer or employee of our company. None of our executive officers serves as a
member of the compensation committee of any entity that has one or more executive officers serving on our compensation committee.
Director Compensation
The following table sets forth information concerning compensation earned by the non-employee members of our Board of Directors in fiscal 2017.
Howard Lerman, our Chief Executive Officer, and Brian Distelburger, our President, are also directors but do not receive any additional compensation for their services as a director. Information
concerning the compensation earned by Mr. Lerman and Mr. Distelburger is set forth in the section titled "Executive Compensation." Mr. Steele joined our Board of Directors in
November 2016 and subsequently resigned in January 2017 in connection with his employment with us. All compensation initially paid to him in connection with his prospective service as a
98
Table of Contents
director
became a component of his employment compensation arrangement and is set forth in "Executive Compensation."
|
|
|
|
|
Name
|
|
Option
Awards ($)(1) |
|
Michael Walrath |
|
$ |
— |
|
Phillip Fernandez |
|
|
739,362 |
|
Jesse Lipson |
|
|
114,732 |
|
Jules Maltz(2) |
|
|
— |
|
Julie Richardson |
|
|
455,226 |
|
Andrew Sheehan |
|
|
— |
|
- (1)
- Represents
the aggregate grant date fair value computed in accordance with Financial Accounting Standards Board Accounting Standards Codification Topic 718,
Compensation-Stock Compensation, or FASB ASC Topic 718. Assumptions used in the calculation of these award amounts are included in Note 8 to our consolidated financial statements included
elsewhere in this prospectus. The grant date and number of shares subject to each option award included in the awards for which expense is shown in the table above is as follows:
|
|
|
|
|
|
|
Name
|
|
Grant Date |
|
Number of Shares
Subject to Option |
|
Phillip Fernandez |
|
December 7, 2016 |
|
|
200,000 |
|
Julie Richardson |
|
December 7, 2016 |
|
|
123,000 |
|
Jesse Lipson |
|
December 7, 2016 |
|
|
31,000 |
|
Mr. Fernandez's
options vest monthly as to 5,555 shares over a three-year period. Ms. Richardson's options vest monthly as to 20,500 shares over a six-month period. Mr. Lipson's
options were fully vested upon grant.
- (2)
- Mr.
Maltz served as a director until his resignation in March 2017.
We
also reimburse our non-employee directors for their reasonable out-of-pocket costs and travel expenses in connection with their attendance at Board of Directors and committee
meetings.
The
following table lists all outstanding option awards held by our non-employee directors as of January 31, 2017:
|
|
|
|
|
Name
|
|
Option Awards |
|
Michael Walrath |
|
|
1,572,538 |
|
Phillip Fernandez |
|
|
200,000 |
|
Jesse Lipson |
|
|
303,845 |
|
Jules Maltz |
|
|
— |
|
Julie Richardson |
|
|
245,000 |
|
Andrew Sheehan |
|
|
— |
|
Outside Director Compensation Policy
In March 2017, our Board of Directors adopted our Outside Director Compensation Policy, which will become effective in connection with this
offering. Members of our Board of Directors who are not employees are eligible for awards pursuant to our Outside Director Compensation Policy.
99
Table of Contents
Under
our Outside Director Compensation Policy, non-employee directors will receive compensation in the form of cash and/or equity, as described below:
Cash Compensation
Each non-employee director is eligible to receive the following annual cash retainers for certain board and/or committee
service:
- •
- $30,000 per year for service as a member of our Board of Directors;
- •
- $20,000 per year additionally for service as chair of our Board of Directors;
- •
- $20,000 per year additionally for service as chair of the audit committee;
- •
- $10,000 per year additionally for service as a member of the audit committee (other than chair);
- •
- $15,000 per year additionally for service as chair of the compensation committee;
- •
- $7,500 per year additionally for service as a member of the compensation committee (other than chair);
- •
- $7,500 per year additionally for service as chair of the nominating and corporate governance committee;
and
- •
- $3,750 per year additionally for service as a member of the nominating and corporate governance committee (other than chair).
Cash
retainers will be paid quarterly in arrears on a pro-rated basis. We currently intend to implement a policy where a non-employee director can elect to receive cash compensation in
the form of equity awards.
Equity Compensation
Non-employee directors are eligible to receive all types of equity awards (except incentive stock options) under our 2016 Equity Incentive Plan,
or the 2016 Plan, including discretionary awards not covered under our Outside Director Compensation Policy. Our 2016 Plan is further described in "Executive Compensation—Benefit
Plans—2016 Equity Incentive Plan." All grants of awards under our Outside Director Compensation Policy will be automatic and non-discretionary.
Upon
joining our Board of Directors, each newly-elected non-employee director will receive an initial equity award, or the initial award, under our 2016 Plan with a value of
approximately $300,000. This initial award will vest in approximately equal installments annually over a three-year period, subject to continued service through each vesting date. The initial award
will be in the form of restricted stock or restricted stock units.
On
the date of each annual meeting of stockholders following the effectiveness of our Outside Director Compensation Policy, each non-employee director who is continuing as a director
following the applicable meeting will be granted an annual equity award, or the annual award, under our 2016 Plan with a value of approximately $150,000, provided the non-employee director has served
on our Board of Directors for at least the preceding six months. This annual award will vest as to 100% of the shares on the one-year anniversary of the date of grant. For calendar year 2017, we
currently intend to grant an annual award at the regularly scheduled meeting of our Board of Directors in June 2017.
We
currently intend to implement a policy where a non-employee director can defer the settlement of vested equity awards until his or her separation from our Board of Directors.
100
Table of Contents
Notwithstanding
the vesting schedules described above, the vesting of all equity awards granted to a non-employee director, including any award granted outside of our Outside Director
Compensation Policy, will vest in full upon a "change in control" (as defined in our 2016 Plan).
Our
2016 Plan contains maximum limits, which were approved by our stockholders, on the size of the equity awards that can be granted to each of our non-employee directors in any fiscal
year, but those maximum limits do not reflect the intended size of any potential grants or a commitment to make any equity award grants to our non-employee directors in the future.
Limitations on Director and Officer Liability and Indemnification
Our certificate of incorporation and bylaws limit the liability of our directors and officers to the maximum extent permitted by Delaware law.
Delaware law provides that directors of a corporation will not be personally liable for monetary damages for breach of their fiduciary duties as directors, except liability
for:
- •
- any breach of their duty of loyalty to the corporation or its stockholders;
- •
- acts or omissions not in good faith or which involve intentional misconduct or a knowing violation of law;
- •
- unlawful payments of dividends or unlawful stock repurchases or redemptions; or
- •
- any transaction from which the director derived an improper personal benefit.
Our
certificate of incorporation and our bylaws provide that we are required to indemnify our directors and officers, in each case to the fullest extent permitted by Delaware law. Any
repeal of or modification to our certificate of incorporation and our bylaws may not adversely affect any right or protection of a director or officer for or with respect to any acts or omissions of
such director or officer occurring prior to such amendment or repeal. Our bylaws also provide that we shall advance expenses incurred by a director or officer in advance of the final disposition of
any action or proceeding, and permit us to secure insurance on behalf of any officer, director, employee or other agent for any liability arising out of his or her actions in connection with their
services to us.
We
have entered into separate indemnification agreements with our directors and executive officers, in addition to the indemnification provided for in our certificate of incorporation
and bylaws. These agreements, among other things, provide that we will indemnify our directors and executive officers for certain expenses, including attorney's fees, judgments, fines, penalties and
settlement amounts incurred by a director or executive officer in any action or proceeding arising out of such person's services as one of our directors or executive officers, or any other company or
enterprise to which the person provides services at our request. We believe that these provisions and agreements are necessary to attract and retain qualified persons as directors and executive
officers. We also maintain customary directors' and officers' liability insurance.
The
limitation of liability and indemnification provisions contained in our certificate of incorporation and our bylaws may discourage stockholders from bringing a lawsuit against our
directors for breach of their fiduciary duty. They may also reduce the likelihood of derivative litigation against our directors and officers, even though an action, if successful, might benefit us
and other stockholders. Further, a
stockholder's investment may be adversely affected to the extent that we pay the costs of settlement and damage awards against directors and officers as required by these indemnification provisions.
There is no pending litigation or proceeding involving one of our directors or executive officers as to which indemnification is required or permitted, and we are not aware of any threatened
litigation or proceeding that may result in a claim for indemnification.
101
Table of Contents
EXECUTIVE COMPENSATION
Our named executive officers for fiscal 2017, which consist of our principal executive officer and the next two most highly compensated
executive officers, are:
- •
- Howard Lerman, our chief executive officer;
- •
- Brian Distelburger, our president; and
- •
- James Steele, our president and chief revenue officer.
Fiscal 2017 Summary Compensation Table
The following table provides information regarding the total compensation for services rendered in all capacities that was earned by our named
executive officers in fiscal 2017.
|
|
|
|
|
|
|
|
|
|
|
|
|
|
|
|
|
|
|
|
Name and Principal Position
|
|
Fiscal
Year |
|
Salary ($) |
|
Option
Awards ($)(1) |
|
Non-Equity
Incentive Plan
Compensation
($)(2) |
|
All Other
Compensation
($) |
|
Total ($) |
|
Howard Lerman
Chief Executive Officer |
|
|
2017 |
|
|
395,742 |
|
|
3,608,988 |
|
|
125,000 |
|
|
24,078 |
(3) |
|
4,153,808 |
|
Brian Distelburger
President |
|
|
2017 |
|
|
351,923 |
|
|
1,640,449 |
|
|
100,000 |
|
|
12,894 |
(3) |
|
2,105,266 |
|
James Steele(4)
President and Chief
Revenue Officer |
|
|
2017 |
|
|
20,513 |
|
|
6,485,676 |
|
|
16,438 |
|
|
7,247 |
(3)(5) |
|
6,529,874 |
|
- (1)
- The
amounts in this column represent the aggregate grant-date fair value of the award as computed in accordance with FASB ASC Topic 718. The assumptions used in
calculating the grant-date fair value of the awards reported in this column are set forth in the notes to our audited consolidated financial statements included elsewhere in this prospectus.
- (2)
- The
amounts reported represent the target amounts payable in fiscal 2017 under our executive bonus plan, as described in greater detail under
"—Non-Equity Incentive Plan Compensation."
- (3)
- The
amounts reported represent 100% of the premiums paid for participation in our employee welfare benefits plan. We do not fully pay premiums for all employees.
- (4)
- Mr. Steele
joined us in January 2017 and therefore his salary and all other compensation amounts set forth in the table above were prorated for the portion of
fiscal 2017 in which he was employed with us. All compensation initially paid to him in connection with his service as a director became a component of his employment compensation.
- (5)
- This
amount includes a pro rated monthly housing allowance of $10,000.
Non-Equity Incentive Plan Compensation
We sponsored a fiscal 2017 executive bonus plan in which our named executive officers were participants. Bonuses are payable based on our
achievement of specified company financial targets determined by the compensation committee. For fiscal 2017, the performance metrics were revenue and adjusted EBITDA. We define adjusted EBITDA as net
loss before interest, taxes, depreciation and amortization and the effects of stock-based compensation expense. For fiscal 2017, under our executive bonus plan, Mr. Lerman received a payment of
$125,000, Mr. Distelburger received a payment of $100,000 and Mr. Steele received a payment of $16,438.
102
Table of Contents
Named Executive Officer Employment Arrangements
Howard Lerman
We have entered into a confirmatory employment letter with Howard Lerman, our Chief Executive Officer and Co-Founder. The confirmatory
employment letter has no specific term and provides that Mr. Lerman is an at-will employee. Mr. Lerman's current annual base salary is $400,000, and he is eligible for annual target
incentive payments equal to $250,000.
Mr. Lerman
is eligible for severance and change of control-related benefits as described under "—Change of Control and Severance Policy."
Brian Distelburger
We have entered into a confirmatory employment letter with Brian Distelburger, our President and Co-Founder. The confirmatory employment letter
has no specific term and provides that Mr. Distelburger is an at-will employee. Mr. Distelburger's current annual base salary is $350,000, and he is eligible for annual target incentive
payments equal to $200,000.
Mr. Distelburger
is eligible for severance and change of control-related benefits as described under "—Change of Control and Severance Policy."
James Steele
We have entered into a confirmatory employment letter with Mr. Steele, our President and Chief Revenue Officer. The confirmatory
employment letter has no specific term and provides that Mr. Steele is an at-will employee. Mr. Steele's current annual base salary is $400,000, and he is eligible for annual target
incentive payments equal to $400,000, which includes a guaranteed incentive payment of $200,000 after his first 180 days of employment.
Mr. Steele
is eligible for severance and change of control-related benefits in the Policy as described under "—Change of Control and Severance Policy."
Change of Control and Severance Policy
Our Board of Directors has adopted a Change of Control and Severance Policy, or the Policy, which applies to each of our named executive
officers. The Policy has a term of three years generally and automatically renews for additional one-year terms, unless we provide notice of non-renewal at least 60 days prior to the date of
the automatic renewal. Under the Policy, if we terminate a named executive officer's employment other than for cause, death or disability or the named executive officer resigns for good reason, as
such terms are defined in the Policy, during the period from 60 days prior to until twelve months following a change of control, as defined in the Policy, with such period being referred to as
the change of control period, such named executive officer will be eligible to receive the following severance benefits, less applicable tax withholdings:
- •
- 100% of the named executive officer's then-outstanding and unvested time-based equity awards will become vested and exercisable;
- •
- a lump sum cash amount equal to 18 months (six months for Mr. Steele) of the named executive officer's base salary;
- •
- a lump sum cash amount equal to (x) 150% (100% for Mr. Steele) of the named executive officer's target annual bonus plus
(y) the named executive officer's target annual bonus as in effect for the
103
Table of Contents
Further,
under the Policy, if we terminate a named executive officer's employment other than for cause, death or disability or such named executive officer resigns for good reason any
time other than during the change of control period, such named executive officer will be eligible to receive the following severance benefits, less applicable tax withholdings: 15% of the named
executive officer's then-outstanding and unvested time-based equity awards will become vested and exercisable; continued payments of base salary for 12 months (six months for
Mr. Steele); a lump sum cash amount equal to the named executive officer's target annual bonus as in effect for the fiscal year in which the named executive officer's termination occurs but
prorated based on the number of days the named executive officer was actually employed during the fiscal year; and payment or reimbursement of continued health coverage for the named executive officer
and the named executive officer's dependents under COBRA for a period of up to 12 months (six months for Mr. Steele). To receive the severance benefits upon a qualifying termination,
either in connection with or not in connection with a change of control, a named executive officer must sign and not revoke our standard separation agreement and release of claims within the timeframe
set forth in the Policy and must continue to adhere to the named executive officer's non-competition, non-disclosure, and invention assignment agreement.
If
any of the payments provided for under the Policy or otherwise payable to a named executive officer would constitute "parachute payments" within the meaning of Section 280G of
the Internal Revenue Code and would be subject to the related excise tax under Section 4999 of the Internal Revenue Code, then the named executive officer will be entitled to receive either
full payment of benefits or such lesser amount which would result in no portion of the benefits being subject to the excise tax, whichever results in the greater amount of after-tax benefits to the
named executive officer.
Outstanding Equity Awards at Fiscal 2017 Year-End
The following table sets forth information regarding outstanding equity awards held by our named executive officers as of January 31,
2017.
|
|
|
|
|
|
|
|
|
|
|
|
|
|
|
|
|
Named Executive Officer
|
|
Grant Date |
|
Option Awards—
Number of
Securities
Underlying
Unexercised
Options
Exercisable (#) |
|
Option Awards—
Number of
Securities
Underlying
Unexercised
Options
Unexercisable (#) |
|
Option Awards—
Option Exercise
Price ($) |
|
Option Awards—
Option
Expiration Date |
|
Howard Lerman |
|
|
4/28/2016 |
(1) |
|
— |
|
|
1,100,000 |
|
|
6.11 |
|
|
4/28/2026 |
|
Brian Distelburger |
|
|
4/28/2016 |
(1) |
|
— |
|
|
500,000 |
|
|
6.11 |
|
|
4/28/2026 |
|
James Steele |
|
|
12/7/2016 |
(2) |
|
11,111 |
|
|
188,889 |
|
|
7.18 |
|
|
12/7/2026 |
|
|
|
|
1/17/2017 |
(3) |
|
— |
|
|
1,259,000 |
|
|
7.18 |
|
|
12/30/2026 |
|
- (1)
- One-fourth
of the shares subject to the option vest on April 28, 2017, and one thirty-sixth of the remaining shares subject to the option vest monthly
thereafter, in each case subject to continued service to us.
- (2)
- 5,555
shares subject to the option vested on December 7, 2016, and an additional 5,555 shares vest monthly thereafter, in each case subject to continued
service to us.
- (3)
- One-fifth
of the shares subject to the option vest on January 17, 2018, and one forty-eighth of the remaining shares subject to the option vest monthly
thereafter, in each case subject to continued service to us.
104
Table of Contents
Benefit Plans
2016 Equity Incentive Plan
In December 2016, our Board of Directors adopted, and our stockholders approved, our 2016 Equity Incentive Plan, or the 2016 Plan, which became
effective upon the date of adoption by the Board of Directors. Our 2016 Plan provides for the grant of incentive stock options, within the meaning of Section 422 of the Internal Revenue Code,
to our employees and any of our parent and subsidiary corporations' employees, and for the grant of nonstatutory stock options, restricted stock, restricted stock units, stock appreciation rights,
performance units and performance shares to our employees, directors and consultants and our parent and subsidiary corporations' employees and consultants.
Authorized Shares. A total of 10,000,000 shares of our common stock is reserved for issuance pursuant
to the 2016 Plan. As of January 31,
2017, options to purchase 2,824,000 shares of our common stock were outstanding under our 2016 Plan. In addition, the shares reserved for issuance under our 2016 Plan also include shares returned to
our 2008 Equity Incentive Plan, or the 2008 Plan, as the result of expiration or termination of options or other awards. The maximum number of shares that may be added to the 2016 Plan pursuant to the
foregoing sentence is 24,400,000 shares.
The
number of shares available for issuance under the 2016 Plan will also include an annual increase on the first day of each fiscal year beginning on February 1, 2018, equal to
the least of:
- •
- 10,000,000 shares;
- •
- 4% of the outstanding shares of common stock as of the last day of our immediately preceding fiscal year;
or
- •
- such other amount as our Board of Directors may determine.
If
an award expires or becomes unexercisable without having been exercised in full, is surrendered pursuant to an exchange program, or, with respect to restricted stock, restricted stock
units, performance units or performance shares, is forfeited to or repurchased due to failure to vest, the unpurchased shares or for awards other than stock options or stock appreciation rights, the
forfeited or repurchased shares, will become available for, future grant or sale under the 2016 Plan. With respect to stock appreciation rights, only the net shares actually issued will cease to be
available under the 2016 Plan and all remaining shares under stock appreciation rights will remain available for future grant or sale under the 2016 Plan. Shares that have actually been issued under
the 2016 Plan under any award will not be returned to the 2016 Plan; provided, however, that if shares issued pursuant to awards of restricted stock, restricted stock units, performance shares, or
performance units are repurchased or forfeited, such shares will become available for future grant under the 2016 Plan. Shares used to pay the exercise price of an award or satisfy the tax withholding
obligations related to an award will become available for future grant or sale under the 2016 Plan. To the extent an award is paid out in cash rather than shares, such cash payment will not result in
a reduction in the number of shares available for issuance under the 2016 Plan.
Plan Administration. Our Board of Directors, or one or more committees appointed by our Board of
Directors, administers our 2016 Plan. The
compensation committee of our Board of Directors will administer our 2016 Plan after the completion of this offering. In the case of granting options intended to qualify as "performance-based
compensation" within the meaning of Section 162(m) of the Internal Revenue Code, the committee will consist of two or more "outside directors" within the meaning of Section 162(m) of the
Internal Revenue Code.
In
addition, if we determine it is desirable to qualify transactions under our 2016 Plan as exempt under Rule 16b-3 of the Exchange Act, such transactions will be structured to
satisfy the requirements for exemption under Rule 16b-3. Subject to the provisions of our 2016 Plan, the administrator has the power to administer our 2016 Plan and make all determinations
deemed necessary or advisable for administering the 2016 Plan, including but not limited to, the power to determine the fair market value of our common
105
Table of Contents
stock,
select the services providers to whom awards may be granted, determine the number of shares covered by each award, approve forms of award agreements for use under the 2016 Plan, determine the
terms and conditions of awards (including, but not limited to, the exercise price, the times or times at which the awards may be exercised, any vesting acceleration or waiver or forfeiture
restrictions, and any restriction or limitation regarding any award or the shares relating thereto), construe and interpret the terms of our 2016 Plan and awards granted under it, to prescribe, amend,
and rescind rules relating to our 2016 Plan, including creating sub-plans, and to modify or amend each award, including but not limited to the discretionary authority to extent the post-termination
exercisability period of awards, provided that no option or stock appreciation right will be extended past its original maximum term,
and to allow a participant to defer the receipt of payment of cash or the delivery of shares that would otherwise be due to such participant under an award. The administrator also has the authority to
allow participants the opportunity to transfer outstanding awards to a financial institution or other person or entity selected by the administrator and to institute an exchange program by which
outstanding awards may be surrendered or cancelled in exchange for awards of the same type which may have a higher or lower exercise price and different terms, awards of a different type and/or cash,
or by which the exercise price of an outstanding award is increased or reduced. The administrator's decisions, interpretations, and other actions are final and binding on all participants.
Stock Options. The exercise price of options granted under our 2016 Plan must at least be equal to the
fair market value of our common stock on the
date of grant. The term of an option may not exceed 10 years. With respect to any participant who owns more than 10% of the voting power of all classes of our outstanding stock, the term must
not exceed five years and the exercise price must equal at least 110% of the fair market value on the grant date. The administrator will determine the methods of payment of the exercise price of an
option, which may include cash, shares or other property acceptable to the administrator, as well as other types of consideration permitted by applicable law. Subject to the provisions of our 2016
Plan, the administrator will determine the term of all other options.
After
the termination of service of an employee, director or consultant, he or she may exercise his or her option for the period of time stated in his or her award agreement. Generally,
if termination is due to death or disability, the option will remain exercisable for 12 months. In all other cases, the option will generally remain exercisable for three months following the
termination of service. However, in no event may an option be exercised later than the expiration of its term.
Stock Appreciation Rights. Stock appreciation rights may be granted under our 2016 Plan. Stock
appreciation rights allow the recipient to receive the
appreciation in the fair market value of our common stock between the exercise date and the date of grant. Stock appreciation rights may not a have a term exceeding ten years. Subject to the
provisions of our 2016 Plan, the administrator determines the other terms of stock appreciation rights, including when such rights become exercisable and whether to pay any increased appreciation in
cash or with shares of our common stock, or a combination thereof, except that the per share exercise price for the shares to be issued pursuant to the exercise of a stock appreciation right will be
no less than 100% of the fair market value per share on the date of grant.
After
the termination of service of an employee, director or consultant, he or she may exercise his or her stock appreciation right for the period of time stated in his or her award
agreement. Generally, if termination is due to death or disability, the stock appreciation right will remain exercisable for 12 months. In all other cases, the stock appreciation right will
generally remain exercisable for three months following the termination of service. However, in no event may a stock appreciation right be exercised later than the expiration of its term.
Restricted Stock. Restricted stock may be granted under our 2016 Plan. Restricted stock awards are
grants of shares of our common stock that vest in
accordance with terms and conditions established by the administrator. The administrator will determine the number of shares of restricted stock granted to any employee, director or consultant and,
subject to the provisions of our 2016 Plan, will determine the terms
106
Table of Contents
and
conditions of such awards. The administrator may impose whatever conditions to vesting it determines to be appropriate (for example, the administrator may set restrictions based on the achievement
of specific performance goals or continued service to us); provided, however, that the administrator, in its sole discretion, may accelerate the time at which any restrictions will lapse or be
removed. Recipients of restricted stock awards generally will have voting and dividend rights with respect to such shares upon grant without regard to vesting, unless the administrator provides
otherwise. Shares of restricted stock that do not vest are subject to our right of repurchase or forfeiture.
Restricted Stock Units. Restricted stock units may be granted under our 2016 Plan. Restricted stock
units are bookkeeping entries representing an
amount equal to the fair market value of one share of our common stock. Subject to the provisions of our 2016 Plan, the administrator determines the terms and conditions of restricted stock units,
including the vesting criteria and the form and timing of payment. The administrator may set vesting criteria based upon the achievement of company-wide, divisional, business unit, or individual
goals, including, but not limited to, continued employment or service, applicable federal or state securities laws, or any other basis determined by the administrator in its discretion. The
administrator, in its sole discretion, may pay earned restricted stock units in the form of cash, in shares or in some combination thereof. Notwithstanding the foregoing, the administrator, in its
sole discretion, may accelerate the time at which any restrictions will lapse or be removed.
Performance Units and Performance Shares. Performance units and performance shares may be granted under
our 2016 Plan. Performance units and
performance shares are awards that will result in a payment to a participant only if performance goals established by the administrator are achieved or the awards otherwise vest. The administrator
will establish performance objectives or other vesting criteria in its discretion, which, depending on the extent to which they are met, will determine the number and/or the value of performance units
and performance shares to be paid out to participants. The administrator may set performance objectives based on the achievement of company-wide, divisional, business unit, or individual goals
(including, but not limited to, continued employment or service), applicable federal or state securities laws, or any other basis determined by the administrator in its
discretion. After the grant of a performance unit or performance share, the administrator, in its sole discretion, may reduce or waive any performance criteria or other vesting provisions for such
performance units or performance shares. Performance units shall have an initial dollar value established by the administrator on or prior to the grant date. Performance shares shall have an initial
value equal to the fair market value of our common stock on the grant date. The administrator, in its sole discretion, may pay earned performance units or performance shares in the form of cash, in
shares or in some combination thereof.
Outside Directors. Our 2016 Plan provides that all outside directors will be eligible to receive all
types of awards, except for incentive stock
options, under the 2016 Plan. In order to provide a maximum limit on the awards that can be made to our outside directors, our 2016 Plan provides that in any given year, an outside director
(i) will not be granted cash-settled awards having a grant-date fair value greater than $750,000, but that in the fiscal year that an outside director first joins our Board of Directors, he or
she may be granted a cash-settled award with a grant-date fair value of up to $1,500,000; and (ii) will not be granted stock-settled awards having a grant-date fair value greater than $750,000,
but that in the fiscal year that an outside director first joins our Board of Directors, he or she may be granted stock-settled awards having a grant-date fair value of up to $1,500,000. The
grant-date fair values will be determined according to FASB ASC Topic 718. The maximum limits do not reflect the intended size of any potential grants or a commitment to make grants to our outside
directors under our 2016 Plan in the future. The actual amount of outside director equity compensation is set forth in an outside director compensation policy. See "Management—Outside
Director Compensation Policy."
Non-Transferability of Awards. Unless the administrator provides otherwise, our 2016 Plan generally
does not allow for the transfer of awards, and
only the recipient of an award may exercise an award during his or her lifetime.
107
Table of Contents
Certain Adjustments. In the event of certain changes in our capitalization, to prevent diminution or
enlargement of the benefits or potential
benefits available under our 2016 Plan, the administrator will adjust the number and class of shares that may be delivered under our 2016 Plan and/or the number, class and price of shares covered by
each outstanding award, and the numerical share limits set forth in our 2016 Plan.
Dissolution or Liquidation. In the event of our proposed liquidation or dissolution, the administrator
will notify participants as soon as
practicable and all awards will terminate immediately prior to the consummation of such proposed transaction.
Merger or Change in Control. Our 2016 Plan provides that in the event of a merger or change in control,
as defined in the 2016 Plan, each outstanding
award will be treated as the administrator determines, including that the successor corporation or its parent or subsidiary will assume or substitute an equivalent award for each outstanding award.
The administrator will not be required to treat all awards similarly.
In
the event that a successor corporation or its parent or subsidiary does not assume or substitute an equivalent award for any outstanding award, then such award will fully vest, all
restrictions on such award will lapse, all performance goals or other vesting criteria applicable to such award will be deemed achieved at 100% of target levels and such award will become fully
exercisable, if applicable, for a specified period prior to the transaction, unless specifically provided for otherwise under the applicable award agreement or other written agreement with the
participant. The award will then terminate upon the expiration of the specified period of time. If an option or stock appreciation right is not assumed or substituted, the administrator will notify
the participant in writing or electronically that such option or stock appreciation right will be exercisable for a period of time determined by the administrator in its sole discretion and the option
or stock appreciation right will terminate upon the expiration of such period.
If
an outside director's awards are assumed or substituted for in a merger or change in control and the service of such outside director is terminated on or following a change in
control, other than pursuant to a voluntary resignation, his or her options and stock appreciation rights, if any, will vest fully and become immediately exercisable, all restrictions on his or her
restricted stock and restricted stock units will lapse and all performance goals or other vesting requirements for his or her performance shares and units will be deemed achieved at 100% of target
levels, and all other terms and conditions met.
Amendment; Termination. The administrator has the authority to amend, suspend or terminate our 2016 Plan
provided such action does not impair the
existing rights of any participant. Our 2016 Plan automatically will terminate in 2026, unless we terminate it sooner.
2017 Employee Stock Purchase Plan
In March 2017, our Board of Directors adopted and our stockholders approved our 2017 Employee Stock Purchase Plan, or the ESPP, which became
effective on the date it was adopted by our Board of Directors. We believe that allowing our employees to participate in our ESPP provides them with a further incentive towards ensuring our success
and accomplishing our corporate goals.
Authorized Shares. A total of 1,500,000 shares of our common stock are available for sale under our
ESPP. The number of shares of our common stock
that will be available for sale under our ESPP also includes an annual increase on the first day of each fiscal year beginning on February 1, 2018, equal to the least
of:
- •
- 2,500,000 shares;
- •
- 1% of the outstanding shares of our common stock as of the last day of the immediately preceding fiscal year; or such other amount as the
administrator may determine.
108
Table of Contents
Plan Administration. Our Board of Directors, or a committee appointed by our Board of Directors will
administer our ESPP, and have full but
non-exclusive authority to interpret the terms of our ESPP and determine eligibility to participate, subject to the conditions of our ESPP, as described below. We expect our compensation committee to
administer our ESPP. The administrator will have full and exclusive discretionary authority to construe, interpret, and apply the terms of the ESPP, to designate separate offerings under the ESPP, to
designate our subsidiaries and affiliates as participating in the
ESPP, to determine eligibility, to adjudicate all disputed claims filed under the ESPP and to establish procedures that it deems necessary for the administration of the ESPP.
Eligibility. Generally, all of our employees will be eligible to participate if they are employed by us,
or any participating subsidiary, for at
least 20 hours per week and more than five months in any calendar year. The administrator, in its discretion, may, prior to an enrollment date for all options granted on such enrollment date in
an offering, determine that an employee who (i) has not completed at least two years of service since his or her last hire date, (ii) customarily works not more than 20 hours per
week (or a lesser period of time determined by the administrator), (iii) customarily works not more than five months per calendar year (or a lesser period of time determined by the
administrator), (iv) is a highly compensated employee within the meaning of Section 414(v) of the Code or is an officer or subject to disclosure requirements under Section 16(a)
of the Exchange Act, is or is not eligible to participate in such offering period.
However,
an employee may not be granted rights to purchase shares of our common stock under our ESPP if such employee:
- •
- immediately after the grant would own capital stock possessing 5% or more of the total combined voting power or value of all classes of our
capital stock; or
- •
- hold rights to purchase shares of our common stock under all of our employee stock purchase plans that accrue at a rate that exceeds $25,000
worth of shares of our common stock for each calendar year.
Offering Periods. Our ESPP includes a component that allows us to make offerings intended to qualify
under Section 423 of the Code and a
component that allows us to make offerings not intended to qualify under Section 423 of the Code to designated companies, as described in our ESPP. Our ESPP provides for six-month offering
periods. The offering periods are scheduled to start on the first trading day on or after March 15 and September 15 of each year, except for the first offering period, which will
commence on the first trading day on or after completion of this offering and will end on the first trading day on or after September 15 and March 15, approximately six months later.
Each offering period will include purchase periods, which will be the approximately six-month period commencing with one exercise date and ending with the next exercise date.
Contributions. Our ESPP permits participants to purchase shares of our common stock through payroll
deductions of up to 15% of their eligible
compensation. A participant may purchase a maximum of 10,000 shares of our common stock during a purchase period.
Exercise of Purchase Right. Amounts deducted and accumulated by the participant are used to purchase
shares of our common stock at the end of each
six-month purchase period. The purchase price of the shares will be 85% of the lower of the fair market value of our common stock on the first trading day of each offering period or on the exercise
date. Participants may end their participation at any time during an offering period and will be paid their accrued contributions that have not yet been used to purchase shares of our common stock.
Participation ends automatically upon termination of employment with us.
Non-Transferability. A participant may not transfer rights granted under our ESPP. If our compensation
committee permits the transfer of rights, it
may only be done by will, the laws of descent and distribution or as otherwise provided under our ESPP.
109
Table of Contents
Merger or Change in Control. Our ESPP provides that in the event of a merger or change in control, as
defined under our ESPP, a successor corporation
may assume or substitute each outstanding purchase right. If the successor corporation refuses to assume or substitute for the outstanding purchase right, the offering period then in progress will be
shortened, and a new exercise date will be set that will be before the date of the proposed merger or change in control. The administrator will notify each participant that the exercise date has been
changed and that the participant's option will be exercised automatically on the new exercise date unless prior to such date the participant has withdrawn from the offering period.
Amendment; Termination. The administrator has the authority to amend, suspend or terminate our ESPP,
except that, subject to certain exceptions
described in our ESPP, no such action may adversely affect
any outstanding rights to purchase shares of our common stock under our ESPP. Our ESPP automatically will terminate in 2037, unless we terminate it sooner.
2008 Equity Incentive Plan
In 2008, our Board of Directors adopted, and our stockholders approved, our 2008 Equity Incentive Plan, or the 2008 Plan. Our 2008 Plan
permitted the grant of incentive stock options, within the meaning of Section 422 of the Code, to our employees and any subsidiary corporations' employees, and for the grant of nonstatutory
stock options, restricted stock, and restricted stock units to our employees, directors and consultants and our subsidiary corporations' employees and consultants. The 2008 Plan was terminated in
connection with the adoption of the 2016 Plan and we will not grant any additional awards under the 2008 Plan. However, the 2008 Plan will continue to govern the terms and conditions of the
outstanding awards previously granted thereunder.
Authorized Shares. No further shares are authorized for issuance under our 2008 Plan. As of
January 31, 2017, options to purchase
23,185,118 shares of our common stock were outstanding under our 2008 Plan, no shares of restricted stock were outstanding under our 2008 Plan, and 330,000 restricted stock units were
outstanding under our 2008 Plan. In the event that an outstanding award for any reason expires or is canceled, the shares allocable to the unexercised portion of such awards shall be added to the
number of shares then available for issuance under the 2016 Plan, subject to the limits set forth under the 2016 Plan.
Plan Administration. Our Board of Directors or a committee appointed by our Board of Directors
administers our 2008 Plan. Subject to the provisions
of our 2008 Plan, our administrator has the power to administer our 2008 Plan and make all determinations deemed necessary or advisable for administering the 2008 Plan, including the ability to grant
awards under the 2008 Plan including selecting the persons to whom awards may be granted, determining the type of award to be granted to any person, determining the number and type of shares to be
covered by each award, establishing the terms and conditions of each award agreement, determining whether and under what circumstances an option may be exercised without a payment of cash, and
determining whether and to what extent and under what circumstances shares and other amounts payable with respect to an award may be deferred either automatically or at the election of the
participant. In addition the administrator has the authority to adopt, alter, and repeal such administrative rules, guidelines, and practices governing the 2008 Plan as it deems advisable, to
establish the terms of each award agreement, to interpret the terms and conditions of the 2008 Plan and any award issued thereunder, and to otherwise supervise the administration of the 2008 Plan. The
administrator may correct any defect, supply any omission, or reconcile any inconsistency in the 2008 Plan or in any award in the manner and to the extent it deems necessary to carry out the intent of
the 2008 Plan. The administrator's decisions, interpretations, and other actions are final and binding on all participants.
Options. Stock options were granted under our 2008 Plan. The exercise price of options granted under
our 2008 Plan must at least be equal to the fair
market value of our common stock on the date of grant. The term of an option may not exceed 10 years. With respect to any participant who owns more than 10% of the voting power of all classes
of our outstanding stock, the term of an incentive stock option
110
Table of Contents
granted
to such participant must not exceed five years and the exercise price must equal at least 110% of the fair market value on the grant date. The administrator will determine the methods of
payment of the exercise price of an option, which may include a certified or bank check or previously acquired shares based on the fair market value of shares on the date the option is exercised.
If
an individual's service terminates other than due to cause, as defined in the 2008 Plan, or the participant's death or disability, the participant may exercise his or her option
during the time specified by the administrator or, if not specified by the administrator, within 90 days of termination. If an individual's service is terminated for cause, any option not
exercised will immediately and automatically forfeit as of the date of such termination and any shares for which we have not yet delivered share certificates will immediately and automatically forfeit
and we will refund to such individual any option exercise price paid for such shares, if any. If an individual's service terminates due to the participant's death or disability, the option may be
exercised during the time specified by the administrator, or, if not specified by the administrator, within 12 months of termination. However, in no event may an option be exercised later than
the expiration of its term. Subject to the provisions of our 2008 Plan, the administrator determines the other terms of options.
Restricted Stock. Restricted stock awards were granted under our 2008 Plan. Restricted stock awards are
grants of shares of our common stock that
vest in accordance with terms and conditions established by the administrator. The administrator determined the number of shares of restricted stock granted to employees, directors or consultants and
the terms and conditions of such awards. The administrator may impose whatever conditions for lapse of the restriction on the shares it determines to be appropriate (for example, the administrator may
condition the lapse of restrictions on the continued employment or service of the individual or the attainment of specified individual or corporate performance goals). The administrator, in its sole
discretion, as determined at the time of an award, may permit or require the payment of cash distributions or dividends to be deferred and, if the administrator so determines, reinvested in additional
restricted stock. Shares of restricted stock as to which the restrictions have not lapsed are subject to our right of repurchase or forfeiture.
Restricted Stock Units. Restricted stock units were granted under our 2008 Plan. Restricted stock units
are bookkeeping entries representing an
amount equal to the fair market value of one share of our common stock at the time of distribution. Subject to the provisions of our 2008 Plan, the administrator determined the terms and conditions of
restricted stock units, including the vesting criteria and the form and timing of payment. The administrator, in its sole discretion, may pay earned restricted stock units in the form of cash, in
shares or in some combination thereof. All other terms governing restricted stock units such as vesting, time and form of payment, and termination of restricted stock units, are set forth in the award
agreement.
Non-Transferability of Awards. Unless the administrator provides otherwise, our 2008 Plan generally
does not allow for the transfer of awards and
only the recipient of an award may exercise an award during his or her lifetime. Notwithstanding the foregoing, a nonqualified stock option may be assigned in whole or in part during the participant's
lifetime to one or more members of his or her family or to a trust established exclusively for the participant and/or one or more such family members or to his or her spouse, to the extent such
assignment is in connection with the participant's estate plan or pursuant to a domestic relations order.
Certain Adjustments. In the event of certain changes in our capitalization, to prevent diminution or
enlargement of the benefits or potential
benefits available under our 2008 Plan, the administrator will adjust the number of shares covered by each outstanding award, and the exercise or purchase price of outstanding awards under the 2008
Plan.
Change in Control. Our 2008 Plan provides that in the event of a change in control, as defined under the
2008 Plan, the administrator may, in its
sole and absolute discretion and without the need for the
111
Table of Contents
consent
of any participant, take one or more of the following actions: accelerate the vesting of all outstanding options, in whole or in part, cause any or all outstanding restricted stock or
restricted stock units to become non-forfeitable, in whole or in part, provide for the substitution of awards, redeem any restricted stock for cash and/or other substitute consideration with a value
equal to the fair market value of a share on the date of the change in control, cancel any option in exchange for cash and/or other substitute consideration with a value equal to the number of shares
subject to the option
multiplied by the difference between the fair market value per share on the date of the change in control and the exercise price of that option (provided that if the fair market value is not greater
than the exercise price, the option may be cancelled without any payment therefor), or cancel any restricted stock unit in exchange for cash and/or other substitute consideration with a value equal to
the fair market value per share on the date of the change in control.
Amendment, Termination. Our Board of Directors has the authority to amend the 2008 Plan, provided that
such action will not impair the existing
rights of any participant without such participant's consent. As noted above, our 2008 Plan was terminated in connection with our adoption of our 2016 Plan and no further awards will be granted
thereunder. All outstanding awards will continue to be governed by their existing terms.
Employee Incentive Plan
In December 2015, our Board of Directors adopted our Employee Incentive Plan, or our Incentive Plan. Our Incentive Plan allows our compensation
committee to provide cash incentive awards to employees selected by our compensation committee, including our named executive officers, based upon performance goals established by our compensation
committee.
Under
our Incentive Plan, our compensation committee determines the performance goals applicable to any award, which goals may include, without limitation, the attainment of research and
development milestones, billings, bookings, business divestitures and acquisitions, cash flow, cash position, contract awards or backlog, customer-related measures, customer retention rates from an
acquired company, business unit or division, earnings (which may include earnings before interest, taxes, depreciation and amortization, earnings before taxes and net earnings), earnings per share,
employee retention, employee mobility, expenses, geographic expansion, gross margin, growth in stockholder value relative to the moving average of the S&P 500 Index or another index, hiring
targets, internal rate of return, inventory turns, inventory levels, market share, milestone achievements, net billings, net income, net profit, net revenue margin, net sales, new product development,
new product invention or innovation, number of customers, operating cash flow, operating expenses, operating income, operating margin, origination volume, overhead or other expense reduction,
portfolio conversion rate, product defect measures, product development, product release timelines, productivity, profit, return on assets, return on capital, return on equity, return on investment,
return on sales, revenue, revenue growth, sales results, sales growth, stock price, time to market, total stockholder return, units sold (total and new), working capital, and individual objectives
such as MBOs, peer reviews or other subjective or objective criteria. The performance goals may differ from participant to participant and from award to award.
Our
compensation committee will administer our Incentive Plan. The administrator of our Incentive Plan may, in its sole discretion and at any time, increase, reduce or eliminate a
participant's actual
award, and/or increase, reduce or eliminate the amount allocated to the incentive pool for a particular performance period. The actual award may be below, at or above a participant's target award, in
the discretion of the administrator. The administrator may determine the amount of any reduction on the basis of such factors as it deems relevant, and it is not required to establish any allocation
or weighting with respect to the factors it considers. In taking any of these actions, the administrator will not be obligated to treat all actual awards or participants similarly.
112
Table of Contents
An
actual award is not considered earned until paid and will be paid in cash or its equivalent. Accordingly, to receive an actual award, continued employment through the last day of the
performance period and the date the actual award is paid is required. The compensation committee reserves the right to settle an actual award with the grant of an equity award under our then-current
equity compensation plan.
Our
compensation committee has the authority to amend or terminate our Incentive Compensation Plan, provided such action does not impair the existing rights of any participant with
respect to any earned awards without his or her consent.
401(k) Plan
We maintain a tax-qualified retirement plan, or the 401(k) plan, that provides eligible employees with an opportunity to save for retirement on
a tax-advantaged basis. Eligible employees are able to participate in the 401(k) plan on the date they meet the 401(k) plan's eligibility requirements. All participants' interests in their deferrals
are 100% vested when contributed. The 401(k) plan permits us to make matching contributions and profit sharing contributions to eligible participants, although to date we have not made any such
contributions.
113
Table of Contents
CERTAIN RELATIONSHIPS AND RELATED PERSON TRANSACTIONS
Policies and Procedures for Transactions with Related Persons
Our Board of Directors has adopted a written related party transaction policy setting forth the policies and procedures for the review, approval
and ratification of related person transactions, which will become effective upon this offering. A related person transaction refers to any transaction, arrangement or relationship, or any series of
similar transactions, arrangements or relationships, or any proposed transaction, arrangement or relationship, in which we (including any of our subsidiaries) are a participant and in which any
related person has, had or will have a direct or indirect material interest and the aggregate amount involved exceeds $120,000, subject to the exceptions set forth in Item 404 of
Regulation S-K under the Securities Act of 1933, as amended. A related person refers to our directors, director nominees and executive officers, any person or entity known by us to be the
beneficial owner of more than 5% of any class of our voting securities, or any immediate family member of any of the foregoing.
Related
person transactions are reviewed, approved and ratified by the audit committee of our Board of Directors. The audit committee of our Board of Directors will be provided with the
details of each related person transaction (or proposed related person transaction), including the terms of the transaction, the business purpose of the transaction and the benefits to us and to the
relevant related person. In the event our management determines that it is impractical or undesirable to wait until a meeting of the audit committee to consummate a related person transaction, the
chairman of the audit committee may approve such transaction. Any such approval must be reported to the audit committee at its next regularly scheduled meeting.
In
determining whether to approve or ratify a related person transaction, the audit committee (or the chairman of the audit committee, if applicable) will consider, among other factors,
the following factors to the extent relevant to the related person transaction: whether the terms of the related person transaction are fair to our company and on terms no less favorable than terms
generally available to an unaffiliated third party under the same or similar circumstances; the extent of the related person's interest in the transaction; whether there are business reasons for us to
enter into the related person transaction; whether the related person transaction would impair the independence of an outside director; and whether the related person transaction would present an
improper conflict of interest for any of our directors or executive officers, taking into account the size of the transaction, the overall financial position of the director, executive officer or
related person, the direct or indirect nature of the director's, executive officer's or related person's interest in the transaction and the ongoing nature of any proposed relationship, and any other
factors the audit committee deems relevant. After considering all such facts, circumstances and factors, our audit committee determines whether approval or ratification of the related person
transaction is in our best interests. Any member of the audit committee who has an interest in the transaction under discussion will abstain from voting on the approval of the related person
transaction. The audit committee shall update the Board of Directors with respect to any related person transactions as part of its regular updates to the Board of Directors regarding audit committee
activities.
If
a related person transaction is of the type that will be ongoing, the audit committee may establish guidelines for us to follow in our ongoing dealings with the related person, and
the audit committee shall review and assess such ongoing relationships. A related person transaction entered into without pre-approval of the audit committee shall not be deemed to violate our related
person transaction policy, or be invalid or unenforceable, so long as the transaction is brought to the audit committee as promptly as reasonably practical after it is entered into or after it becomes
reasonably apparent that the transaction is covered by the policy, and the transaction is ratified by the audit committee.
114
Table of Contents
Transactions and Relationships with Directors, Officers and 5% Stockholders
The following is a summary of related person transactions since February 1, 2014 to which we have been a participant in which the amount
involved exceeded or will exceed $120,000, and in which any of our directors, executive officers or holders of more than five percent of our capital stock, or any members of their immediate family,
had or will have a direct or indirect material interest, other than compensation arrangements which are described under "Management—Executive Compensation" and
"Management—Director Compensation."
Sale of Series F Convertible Preferred Stock
On May 28, 2014, we sold an aggregate of 8,642,486 shares of our Series F Convertible Preferred Stock at a price of $5.81 per
share for an aggregate purchase price of approximately $50.3 million. The following table summarizes purchases of our Series F Convertible Preferred Stock by members of our Board of
Directors, entities affiliated with members of our Board of Directors and holders of more than 5% of our outstanding capital stock:
|
|
|
|
|
|
|
|
Purchaser
|
|
Shares of Series F
Convertible
Preferred Stock |
|
Total
Purchase Price |
|
Entities and individuals affiliated with Insight Venture Partners(1) |
|
|
4,342,740 |
|
$ |
25,249,993 |
|
Entities and individuals affiliated with Institutional Venture Partners(2) |
|
|
1,891,888 |
|
|
11,000,004 |
|
Marker II LP(3) |
|
|
1,891,888 |
|
|
11,000,004 |
|
Entities and individuals affiliated with Sutter Hill Ventures(4) |
|
|
515,970 |
|
|
3,000,004 |
|
- (1)
- Affiliates
of Insight Venture Partners whose shares are aggregated for purposes of reporting share ownership information are: Insight Venture Partners
VIII, L.P.; Insight Venture Partners (Cayman) VIII, L.P.; Insight Venture Partners VIII (Co-Investors), L.P. and Insight Venture Partners (Delaware) VIII, L.P. These
affiliates are beneficial owners of more than 5% of our capital stock.
- (2)
- Affiliates
of Institutional Venture Partners whose shares are aggregated for purposes of reporting share ownership information are: Institutional Venture Partners
XII, L.P.; Institutional Venture Partners XII, L.P.; Institutional Venture Partners XI, L.P.; and Institutional Venture Partners XI, GmbH & Co. Beteiligungs
KG. Entities and affiliates of Institutional Venture Partners are beneficial owners of more than 5% of our capital stock.
- (3)
- Marker
II LP is an affiliate of Marker Financial Advisors LLC. Entities and affiliates of Marker Financial Advisors LLC are beneficial owners of
more than 5% of our capital stock.
- (4)
- Shares
held by individuals and entities associated with Sutter Hill Ventures are aggregated for purposes of reporting share ownership information. Andrew Sheehan, a
member of our Board of Directors, is a managing director of Sutter Hill Ventures. The Sheehan 2003 Trust holds 2,147 shares of Series F Preferred Stock. Individuals and entities associated with
Sutter Hill Ventures are beneficial owners of more than 5% of our capital stock.
Tender Offer and Related Sale of Common Stock
On July 16, 2015, we entered into a Common Stock Purchase Agreement with certain holders of our capital stock pursuant to which we agreed
to sell such holders an aggregate number of shares of our common stock equal to the total number of tendered shares of common stock sold by eligible holders to us in connection with a contemporaneous
self-tender offer at a price equal to $5.00 per share. In July 2015, we commenced the self-tender offer to (i) purchase shares of common stock at $5.00 per share and (ii) cancel vested
stock options to purchase shares of our common stock at a price per share equal to $5.00 less the applicable per share exercise price.
Common
stock and options to purchase shares of common stock representing an aggregate of 5,894,935 shares were tendered or cancelled pursuant to the tender offer in exchange for an
aggregate
115
Table of Contents
purchase
price of $29,474,675. The following table summarizes our purchases of shares of common stock and cancellations of options in the tender offer from related persons:
|
|
|
|
|
|
|
|
|
|
|
Seller
|
|
Shares of
Common Stock
Sold to the Company |
|
Shares Subject to
Options Cancelled for
Cash Payment |
|
Total
Purchase Price |
|
Howard Lerman |
|
|
2,352,625 |
|
|
— |
|
$ |
11,763,125 |
|
Brian Distelburger |
|
|
1,764,469 |
|
|
— |
|
|
8,822,345 |
|
Tom Dixon |
|
|
— |
|
|
325,272 |
|
|
1,065,762 |
|
Following
completion of the tender offer, we then sold an aggregate of 5,894,935 shares of common stock, the same number as the shares that had been tendered, pursuant to the Common
Stock Purchase Agreement for an aggregate purchase price of $29,474,675. The following table summarizes sales of shares of common stock by us to related persons:
|
|
|
|
|
|
|
|
Purchaser
|
|
Shares of Common Stock
Purchased from the Company |
|
Total
Purchase Price |
|
Entities and individuals affiliated with Insight Venture Partners(1) |
|
|
3,065,366 |
|
$ |
15,326,830 |
|
Marker Yext I-A, L.P.(2) |
|
|
2,045,542 |
|
|
10,227,710 |
|
Entities and individuals affiliated with Institutional Venture Partners(3) |
|
|
589,494 |
|
|
2,947,470 |
|
Tippet Venture Partners, L.P.(4) |
|
|
194,533 |
|
|
972,665 |
|
- (1)
- Affiliates
of Insight Venture Partners whose shares are aggregated for purposes of reporting share ownership information are: Insight Venture Partners
VIII, L.P.; Insight Venture Partners (Cayman) VIII, L.P.; Insight Venture Partners VIII (Co-Investors), L.P. and Insight Venture Partners (Delaware) VIII, L.P.
- (2)
- Marker
Yext I-A, L.P. is an affiliate of Marker Financial Advisors LLC.
- (3)
- Affiliates
of Institutional Venture Partners whose shares are aggregated for purposes of reporting share ownership information are: Institutional Venture Partners
XII, L.P.; Institutional Venture Partners XII, L.P.; Institutional Venture Partners XI, L.P.; and Institutional Venture Partners XI, GmbH & Co. Beteiligungs
KG.
- (4)
- Andrew
Sheehan, a member of our Board of Directors, is a managing director of Tippet Venture Partners.
Investors' Rights Agreement
We are party to an investors' rights agreement which provides, among other things, that certain holders of our capital stock have the right to
demand that we file a registration statement or request that their shares of our capital stock be included in a registration statement that we are otherwise filing. Messrs. Lerman and
Distelburger, the Sheehan 2003 Trust, WGI Group, LLC, of which Michael Walrath, a member of our Board of Directors, is a partner, and entities and affiliates of each of Insight Venture
Partners, Marker Financial Advisors LLC, Institutional Venture Partners and Sutter Hill Ventures are parties to the investors' rights agreement. See "Description of Capital
Stock—Registration Rights" for additional information regarding these registration rights.
Right of First Refusal
Pursuant to certain agreements with our stockholders, including a right of first refusal and co-sale agreement, we have a right to purchase
shares of our capital stock which stockholders propose to sell to other parties. Messrs. Lerman and Distelburger, the Sheehan 2003 Trust, WGI Group and entities and affiliates of each of
Insight Venture Partners, Marker Financial Advisors LLC, Institutional Venture Partners and Sutter Hill Ventures are parties to the right of first refusal and co-sale agreement. This agreement
will terminate upon completion of this offering. Since February 1, 2014, we have waived our right of first refusal in connection with the sale of certain shares of our capital stock, resulting
in the
116
Table of Contents
purchase
of such shares by certain holders of more than 5% of our capital stock. See "Principal Stockholders" for additional information regarding beneficial ownership of our capital stock.
Voting Agreement
We are party to a voting agreement under which certain holders of our capital stock, including entities with which certain of our directors are
affiliated, have agreed to vote their shares of our capital stock on certain matters, including with respect to the election of directors. Messrs. Lerman and Distelburger, the Sheehan 2003
Trust, WGI Group and entities and affiliates of each of Insight Venture Partners, Marker Financial Advisors LLC, Institutional Venture Partners and Sutter Hill Ventures are parties to the
voting agreement. Upon completion of this offering, the voting agreement will terminate and none of our stockholders will have any special rights regarding the election or designation of members of
our Board of Directors.
Indemnification Agreements
We have entered into an indemnification agreement with each of our directors and executive officers. The indemnification agreements and our
certificate of incorporation and bylaws require us to indemnify our directors and executive officers to the fullest extent permitted by Delaware law. See "Management—Limitations on
Director and Officer Liability and Indemnification."
117
Table of Contents
PRINCIPAL STOCKHOLDERS
The following table sets forth certain information with respect to the beneficial ownership of our common stock as of January 31, 2017,
referred to in the table below as the "Beneficial Ownership Date," by:
- •
- each beneficial owner of 5% or more of the outstanding shares of our common stock;
- •
- each of our directors;
- •
- each of our named executive officers; and
- •
- all directors and executive officers as a group.
Beneficial
ownership is determined in accordance with the rules of the SEC. In computing the number of shares beneficially owned by a person and the percentage ownership of that person,
shares of common stock subject to options or warrants held by that person that are currently exercisable or exercisable within 60 days of the Beneficial Ownership Date are deemed outstanding,
but are not deemed outstanding for computing the percentage ownership of any other person. Percentage of beneficial ownership is based on 74,989,470 shares of common stock outstanding as of the
Beneficial Ownership Date, which includes 43,594,753 shares of common stock resulting from the automatic conversion of all then outstanding shares of our convertible preferred stock upon the closing
of this offering, as if such conversion had occurred as of the Beneficial Ownership Date. Percentage ownership of our common stock after this offering assumes our sale of 10,500,000 shares of common
stock in this offering.
To
our knowledge, except as set forth in the footnotes to this table and subject to applicable community property laws, each person named in the table has sole voting and investment
power with respect to the shares set forth opposite such person's name. Except as otherwise indicated, the address of each of the persons in this table is c/o Yext, Inc. 1 Madison Avenue,
5th Floor, New York, New York 10010.
|
|
|
|
|
|
|
|
|
|
|
|
|
|
|
Percent of Shares
Beneficially Owned |
|
Name of Beneficial Owner
|
|
Number of Shares
Beneficially Owned |
|
Prior to the
Offering |
|
After the
Offering |
|
Directors and Named Executive Officers: |
|
|
|
|
|
|
|
|
|
|
Howard Lerman |
|
|
7,353,585 |
|
|
9.8 |
% |
|
8.6 |
% |
Brian Distelburger(1) |
|
|
4,951,541 |
|
|
6.6 |
|
|
5.8 |
|
James Steele(2) |
|
|
22,222 |
|
|
* |
|
|
* |
|
Michael Walrath(3) |
|
|
5,047,211 |
|
|
6.6 |
|
|
5.8 |
|
Phillip Fernandez(4) |
|
|
27,777 |
|
|
* |
|
|
* |
|
Jesse Lipson(5) |
|
|
303,845 |
|
|
* |
|
|
* |
|
Julie Richardson(6) |
|
|
261,333 |
|
|
* |
|
|
* |
|
Andrew Sheehan(7) |
|
|
710,719 |
|
|
* |
|
|
* |
|
All executive officers and directors (10 persons)(8) |
|
|
20,541,550 |
|
|
26.0 |
|
|
23.0 |
|
Other Principal Stockholders: |
|
|
|
|
|
|
|
|
|
|
Entities and individuals affiliated with Sutter Hill Ventures(9) |
|
|
17,657,218 |
|
|
23.6 |
|
|
20.7 |
|
Entities and individuals affiliated with Institutional Venture Partners(10) |
|
|
11,947,722 |
|
|
15.9 |
|
|
14.0 |
|
Entities and individuals affiliated with Marker Financial Advisors LLC(11) |
|
|
10,190,148 |
|
|
13.6 |
|
|
11.9 |
|
Entities and individuals affiliated with Insight Venture Partners(12) |
|
|
7,710,621 |
|
|
10.3 |
|
|
9.0 |
|
Brent Metz |
|
|
6,470,806 |
|
|
8.6 |
|
|
7.6 |
|
- *
- Represents
beneficial ownership of less than 1%.
118
Table of Contents
- (1)
- Does
not include 1,838,397 shares to which Mr. Distelburger currently holds voting control pursuant to a voting trust agreement, which terminates upon the
completion of this offering, at which point Mr. Distelburger will no longer retain voting control over such shares.
- (2)
- Includes
22,222 shares subject to options that are immediately exercisable or exercisable within 60 days of the Beneficial Ownership Date.
- (3)
- Consists
of (a) 3,474,673 shares held by WGI Group, LLC and (b) 1,572,538 shares subject to options and warrants held by
Mr. Walrath and WGI Group, LLC that are immediately exercisable or exercisable within 60 days of the Beneficial Ownership Date. Mr. Walrath has sole voting and investment
control over the shares held by WGI Group, LLC. The address of this entity and persons is c/o WGI Group, LLC, 222 S. Albany St., Ste. 2, Ithaca, NY 14850.
- (4)
- Includes
27,777 shares subject to options that are immediately exercisable or exercisable within 60 days of the Beneficial Ownership Date.
- (5)
- Includes
303,845 shares subject to options that are immediately exercisable or exercisable within 60 days of the Beneficial Ownership Date.
- (6)
- Includes
(a) 193,833 shares subject to options that are immediately exercisable or exercisable within 60 days of the Beneficial Ownership Date,
(b) 15,000 shares held by the Jack Douglas Richardson 2010 Trust, of which Ms. Richardson is a trustee, (c) 26,250 shares held by the Charles Matthew Richardson 2006
Trust, of which Ms. Richardson is a trustee, and (d) 26,250 shares held by the Lucas Matthew Richardson 2008 Trust, of which Ms. Richardson is a trustee.
- (7)
- Consists
of (a) 263,671 shares held by the Sheehan 2003 Trust, of which Mr. Sheehan is a co-trustee, and (b) 447,048 shares held by Tippet
Venture Partners, L.P., a limited partnership controlled by Mr. Sheehan as the managing director of its general partner.
- (8)
- Includes
3,983,532 shares subject to options that are immediately exercisable or exercisable within 60 days of the Beneficial Ownership Date.
- (9)
- Consists
of (a) 10,181,717 shares held by Sutter Hill Ventures, a California limited partnership ("SHV") and (b) an aggregate of 7,475,501 shares that
are held by individuals and entities associated with SHV, including the 710,719 shares beneficially owned by Mr. Sheehan and described in footnote 7. Voting and investment authority over
the shares held by SHV are shared by members of the management committee of the general partner of SHV, which consists of Jeffrey W. Bird, Tench Coxe, Stefan A. Dyckerhoff, Samuel J. Pullara III,
Michael L. Speiser and James N. White. The address for these entities and persons is 755 Page Mill Road, Suite A-200. Palo Alto, CA 94304.
- (10)
- Consists
of (a) 11,328,558 shares held of record by Institutional Venture Partners XII, L.P, (b) 533,719 shares held of
record by Institutional Venture Partners XI, L.P., and (c) 85,445 shares held of record by Institutional Venture Partners XI GmbH & Co Beteiligungs KG.
Institutional Venture Management XII, LLC is the general partner of Institutional Venture Partners XII, L.P. Institutional Venture Management XI, LLC is the general partner
of Institutional Venture Partners XI, L.P. and the managing limited partner of Institutional Venture Partners XI GmbH & Co Beteiligungs KG. Todd C. Chaffee, Norman
A. Fogelsong, Stephen J. Harrick, J. Sanford Miller and Dennis B. Phelps are the managing directors of Institutional Venture Management XII, LLC and share voting and dispositive power over the
shares held by Institutional Venture Partners XII, L.P. Todd C. Chaffee, Reid W. Dennis, Norman A. Fogelsong, Stephen J. Harrick, J. Sanford Miller and Dennis B. Phelps are the managing
directors of Institutional Venture Management XI, LLC and share voting and dispositive power over the shares held by Institutional Venture Partners XI, L.P. and Institutional
Venture Partners XI GmbH & Co Beteiligungs KG. The address for these entities is c/o Institutional Venture Partners, 3000 Sand Hill Road, Building 2,
Suite 250, Menlo Park, California 94025.
- (11)
- Consists
of (i) 4,764,115 shares held of record by Marker Yext I-A, L.P.; (ii) 1,891,888 shares held of record by Marker II LP; and
(iii) 3,534,145 shares held of record by Marker Yext I, L.P.; Marker Yext I Manager Ltd., as Sole Member of Marker Yext GP, LLC, and Marker
II GP, Ltd., the funds' respective General Partners and the Member Manager of Marker Financial Advisors LLC, the Manager for the funds. The principal business address of the
entities affiliated with Marker Financial Advisors LLC is 10 East 53rd St., 14th Floor, New York, New York 10022.
- (12)
- Consists
of (i) 4,784,654 shares held of record by Insight Venture Partners VIII, L.P.; (ii) 1,237,656 shares held of record by Insight
Venture Partners (Cayman) VIII, L.P.; (iii) 170,760 shares held of record by Insight Venture Partners VIII (Co-Investors), L.P.; and (iv) 1,517,551 shares held of
record by Insight Venture Partners (Delaware) VIII, L.P. Insight Holdings Group, LLC ("Holdings") is the sole shareholder of Insight Venture Associates VIII, Ltd.
("IVA Ltd"). IVA Ltd is the general partner of Insight Venture Associates VIII, L.P. ("IVA LP"), which is the general partner of Insight Venture Partners VIII, L.P.,
Insight Venture Partners (Cayman) VIII, L.P. Insight Venture Partners VIII (Co-Investors), L.P. and Insight Venture Partners (Delaware) VIII, L.P. (collectively "Fund VIII"). Each
of Jeffrey L. Horing, Deven Parekh, Peter Sobiloff, Jeffrey Lieberman and Michael Triplett is a member of the board of managers of Holdings. Because Messrs. Horing, Parekh, Sobiloff, Lieberman,
and Triplett are members of the board of managers of Holdings, Holdings is the sole shareholder of IVA Ltd and IVA LP is the general partner of Fund VIII, Messrs. Horing, Parekh,
Sobiloff, Lieberman, and Triplett may be deemed to share voting and dispositive power over the shares noted above. The address for these entities is c/o Insight Venture Partners, 1114 Avenue of the
Americas, 36th Floor, New York, NY, 10036.
119
Table of Contents
DESCRIPTION OF CAPITAL STOCK
The following information describes our common stock and preferred stock and provisions of our amended and restated certificate of incorporation
and bylaws. This description is only a summary and reflects the expected terms of our amended and restated certificate of incorporation and bylaws, each to be effective upon completion of this
offering. You should also refer to our amended and restated certificate of incorporation and bylaws, which will be filed with the Securities and Exchange Commission as exhibits to our registration
statement, of which this prospectus forms a part.
As
of January 31, 2017, there were 74,989,470 shares of common stock outstanding, after giving effect to the automatic conversion of all then outstanding shares of our convertible
preferred stock into 43,594,753 shares of common stock upon the closing of this offering, held by 185 holders of record.
General
Upon the closing of this offering, our authorized capital stock consists of 500,000,000 shares of common stock with a $0.001 par value per
share, and 50,000,000 shares of preferred stock with a $0.001 par value per share, all of which shares of preferred stock are
undesignated. Our Board of Directors may establish the rights and preferences of the preferred stock from time to time.
Common Stock
Each holder of our common stock is entitled to one vote for each share on all matters to be voted upon by the stockholders and there are no
cumulative rights. Subject to any preferential rights of any outstanding preferred stock, holders of our common stock are entitled to receive ratably the dividends, if any, as may be declared from
time to time by the Board of Directors out of legally available funds. If there is a liquidation, dissolution or winding up of our company, holders of our common stock would be entitled to share in
our assets remaining after the payment of liabilities and any preferential rights of any outstanding preferred stock.
Holders
of our common stock have no preemptive or conversion rights or other subscription rights, and there are no redemption or sinking fund provisions applicable to the common stock.
All outstanding shares of our common stock will be fully paid and non-assessable. The rights, preferences and privileges of the holders of our common stock are subject to, and may be adversely
affected by, the rights of the holders of shares of any series of preferred stock which we may designate and issue in the future.
Preferred Stock
Under the terms of our amended and restated certificate of incorporation, our Board of Directors is authorized to issue shares of preferred
stock in one or more series without stockholder approval. We have no present plans to issue any shares of preferred stock. Our Board of Directors has the discretion to determine the rights,
preferences, privileges and restrictions, including voting rights, dividend rights, conversion rights, redemption privileges and liquidation preferences, of each series of preferred stock.
The
purpose of authorizing our Board of Directors to issue preferred stock and determine its rights and preferences is to eliminate delays associated with a stockholder vote on specific
issuances. The issuance of preferred stock, while providing flexibility in connection with possible future acquisitions and other corporate purposes, will affect, and may adversely affect, the rights
of holders of common stock. It is not possible to state the actual effect of the issuance of any shares of preferred stock on the rights of holders of common stock until the Board of Directors
determines the specific rights attached
to that preferred stock. The effects of issuing preferred stock could include one or more of the following:
- •
- restricting dividends on the common stock;
- •
- diluting the voting power of the common stock;
120
Table of Contents
- •
- impairing the liquidation rights of the common stock; or
- •
- delaying or preventing changes in control or management of our company.
Effect of Certain Provisions of our Certificate of Incorporation and Bylaws and the Delaware
Anti-Takeover Statute
Certificate of Incorporation and Bylaws
Some provisions of Delaware law and our certificate of incorporation and bylaws contain provisions that could make the following transactions
more difficult:
- •
- acquisition of us by means of a tender offer;
- •
- acquisition of us by means of a proxy contest or otherwise; or
- •
- removal of our incumbent officers and directors.
These
provisions, summarized below, are designed to discourage coercive takeover practices and inadequate takeover bids and to promote stability in our management. These provisions are
also designed to encourage persons seeking to acquire control of us to first negotiate with our Board of Directors.
- •
- Undesignated Preferred Stock. The ability to authorize undesignated
preferred stock makes it possible for our Board of Directors to issue one or more series of preferred stock with voting or other rights or preferences that could impede the success of any attempt to
change control. These and other provisions may have the effect of deferring hostile takeovers or delaying changes in control or management of our company.
- •
- Calling of Special Meetings of Stockholders. Our charter documents provide
that a special meeting of stockholders may be called only by resolution adopted by our Board of Directors.
- •
- Requirements for Advance Notification of Stockholder Nominations and
Proposals. Our bylaws establish advance notice procedures with respect to stockholder proposals and the nomination of candidates for election as
directors, other than nominations made by or at the direction of the Board of Directors or a committee of the Board of Directors.
- •
- Board Classification. Our Board of Directors is divided into three classes.
The directors in each class will serve for a three-year term, one class being elected each year by our stockholders. This system of electing and removing directors may tend to discourage a third party
from making a tender offer or otherwise attempting to obtain control of us, because it generally makes it more difficult for stockholders to replace a majority of the directors.
- •
- Limits on Ability of Stockholders to Act by Written Consent. We have
provided in our certificate of incorporation that our stockholders may not act by written consent. This limit on the ability of our stockholders to act by written consent may lengthen the amount of
time required to take stockholder actions. As a result, a holder controlling a majority of our capital stock would not be able to amend our bylaws or remove directors without holding a meeting of our
stockholders called in accordance with our bylaws.
- •
- Amendment of Certificate of Incorporation and Bylaws. The amendment of the
above provisions of our certificate of incorporation and bylaws requires approval by holders of at least two-thirds of our outstanding capital stock entitled to vote generally in the election of
directors.
- •
- Directors Removed Only for Cause. Our amended and restated certificate of
incorporation will provide that stockholders may remove directors only for cause.
121
Table of Contents
Delaware Anti-Takeover Statute
Upon completion of this offering, we will be subject to the provisions of Section 203 of the Delaware General Corporation Law. In
general, Section 203 prohibits a publicly held Delaware corporation from engaging in a "business combination" with an "interested stockholder" for a three-year period following the time that
this stockholder becomes an interested stockholder, unless the business combination is approved in a prescribed manner. Under Section 203, a business combination between a corporation and an
interested stockholder is prohibited unless it satisfies one of the following conditions:
- •
- before the stockholder became interested, our Board of Directors approved either the business combination or the transaction which resulted in
the stockholder becoming an interested stockholder;
- •
- upon consummation of the transaction which resulted in the stockholder becoming an interested stockholder, the interested stockholder owned at
least 85% of the voting stock of the corporation outstanding at the time the transaction commenced, excluding for purposes of determining the voting stock outstanding, shares owned by persons who are
directors and also officers, and employee stock plans, in some instances, but not the outstanding voting stock owned by the interested stockholder; or
- •
- at or after the time the stockholder becomes interested, the business combination was approved by our Board of Directors and authorized at an
annual or special meeting of the stockholders by the affirmative vote of at least two-thirds of the outstanding voting stock which is not owned by the interested stockholder.
Section 203
defines a business combination to include:
- •
- any merger or consolidation involving the corporation and the interested stockholder;
- •
- any sale, transfer, lease, pledge or other disposition involving the interested stockholder of 10% of more of the assets of the corporation;
- •
- subject to exceptions, any transaction that results in the issuance or transfer by the corporation of any stock of the corporation to the
interested stockholder;
- •
- subject to exceptions, any transaction involving the corporation that has the effect of increasing the proportionate share of the stock of any
class or series of the corporation beneficially owned by the interested stockholder; and
- •
- the receipt by the interested stockholder of the benefit of any loans, advances, guarantees, pledges or other financial benefits provided by or
through the corporation.
In
general, Section 203 defines an interested stockholder as any entity or person beneficially owning 15% or more of the outstanding voting stock of the corporation and any entity
or person affiliated with or controlling or controlled by the entity or person.
Registration Rights
We and certain of our stockholders are party to an investors' rights agreement. The registration rights provisions of this agreement provide
those stockholders with certain demand and piggyback registration rights with respect to the shares of common stock issuable to them upon conversion of our convertible preferred stock in connection
with this offering and certain other common stock held by such stockholders. Messrs. Lerman, Distelburger and our other co-founder, Brent Metz, cannot initiate a request for registration, but
they have limited rights to include their shares of common stock in a registration in which all holders of registrable securities pursuant to the investors' rights agreement are permitted to
participate.
122
Table of Contents
Demand Registration Rights
At any time beginning 180 days after the effective date of the registration statement of which this prospectus is a part, certain holders
of shares of our common stock have the right to demand that we file a registration statement on Form S-1. These registration rights are subject to specified conditions and limitations,
including our right to defer such requests under certain circumstances, our right to deny such requests after we have effected two such registrations, and the right of the underwriters, if any, to
limit the number of shares included in any such registration under specified circumstances. Upon such a request, we will be required to use our commercially reasonable efforts to effect the
registration as soon as reasonably possible. Holders of an aggregate of 43,705,690 shares of common stock will be entitled to these demand registration rights following this offering.
Piggyback Registration Rights
If we propose to register any of our securities under the Securities Act either for our own account or for the account of other stockholders,
certain holders of shares of our common stock will each be entitled to notice of the registration and will be entitled to include their shares of common stock in the registration statement. These
piggyback registration rights are subject to specified conditions and limitations, including the right of the underwriters to limit the number of shares included in any such registration under
specific circumstances. Holders of an aggregate of 43,705,690 shares of common stock will be entitled to these piggyback registration rights following this offering, including Messrs. Lerman,
Distelburger and Metz.
Registration on Form S-3
At any time after we become eligible to file a registration statement on Form S-3, certain holders of shares of our common stock
will be entitled, upon their request, to have such shares registered by us on a Form S-3 registration statement. This registration on Form S-3 is subject to specific conditions and
limitations, including that such requested registration has an anticipated aggregate offering size to the public of at least $3.0 million and we have not already effected two registrations on
Form S-3 within the preceding twelve-month period. Upon such a request, we will be required to use our commercially reasonable efforts to effect the registration as soon as reasonably possible.
Holders of an aggregate of 43,705,690 shares of common stock will be entitled to these Form S-3 registration rights following this offering, including Messrs. Lerman, Distelburger and
Metz.
Expenses of Registration
We will pay all expenses relating to any demand, piggyback or Form S-3 registrations, other than underwriting discounts, commissions and
stock transfer taxes, subject to specified conditions and limitations.
Termination of Registration Rights
The registration rights granted under the investors' rights agreement, including the limited rights granted to Messrs. Lerman,
Distelburger and Metz, will terminate upon the earliest to occur of (i) such date on or after the closing of this offering when all of a holder's registrable securities could be sold without
restriction under Rule 144 and (ii) the fifth anniversary of the closing of this offering.
Listing on the NYSE
Our common stock has been authorized for listing on the NYSE under the symbol "YEXT".
Transfer Agent and Registrar
The transfer agent and registrar for our common stock is Broadridge Corporate Issuer Solutions, Inc. Its address is 1717 Arch Street,
Suite 1300, Philadelphia, PA 19103.
123
Table of Contents
SHARES ELIGIBLE FOR FUTURE SALE
Prior to this offering, there has been no public market for shares of our common stock. Future sales of substantial amounts of shares of common
stock, including shares issued upon the exercise of outstanding options or warrants, in the public market after this offering, or the possibility of
these sales occurring, could adversely affect the prevailing market price for our common stock or impair our ability to raise equity capital.
We
will have 85,489,470 shares of common stock outstanding after the completion of this offering based on the number of shares outstanding on January 31, 2017 and assuming no
exercise of outstanding options or warrants after such date (87,064,470 shares if the underwriters exercise their over-allotment option in full). Of those shares, the 10,500,000 shares of common stock
sold in the offering (12,075,000 shares if the underwriters exercise their over-allotment option in full) will be freely transferable without restriction, unless purchased by persons deemed to be our
"affiliates" as that term is defined in Rule 144 under the Securities Act. Any shares purchased by an affiliate may not be resold except pursuant to an effective registration statement or an
applicable exemption from registration, including an exemption under Rule 144 promulgated under the Securities Act. The remaining 74,989,470 shares of common stock outstanding immediately
following the completion of this offering are "restricted," which means they were originally sold in offerings that were not registered under the Securities Act. Restricted shares may be sold through
registration under the Securities Act or under an available exemption from registration, such as provided through Rule 144 or Rule 701, which rules are summarized below. Taking into
account the lock-up agreements described below as well as market-standoff provisions described in the respective purchase agreements for such shares, and assuming the underwriters do not release any
stockholders from these agreements, the restricted shares of our common stock will be available for sale in the public market as follows:
- •
- no shares will be eligible for sale immediately upon completion of this offering;
- •
- 74,157,997 shares will become eligible for sale, subject to the provisions of Rule 144 or Rule 701, upon the expiration of
agreements not to sell such shares entered into between the underwriters and such stockholders beginning 180 days after the date of this prospectus;
and
- •
- 831,473 additional shares will be eligible for sale from time to time thereafter upon expiration of their respective required holding periods
under Rule 144, but could be sold earlier if the holders exercise any available registration rights.
Rule 144
In general, under Rule 144 of the Securities Act, as in effect on the date of this prospectus, a person (or persons whose shares are
aggregated) who has beneficially owned restricted stock for at least six months, will be entitled to sell in any three-month period a number of shares that does not exceed the greater
of:
- •
- 1% of the number of shares of common stock then outstanding (approximately 854,895 shares immediately after this offering or 870,645 shares if
the underwriters' over-allotment option is exercised in full); or
- •
- the average weekly trading volume of our common stock on the NYSE during the four calendar weeks immediately preceding the date on which the
notice of sale is filed with the SEC.
Sales
pursuant to Rule 144 are subject to requirements relating to manner of sale, notice and availability of current public information about us. A person (or persons whose
shares are aggregated) who is not deemed to be an affiliate of ours for 90 days preceding a sale, and who has beneficially owned restricted stock for at least one year is entitled to sell such
shares without complying with the manner of sale, public information, volume limitation or notice provisions of Rule 144. Rule 144 will not be available
124
Table of Contents
to
any stockholders until we have been subject to the reporting requirements of the Exchange Act for 90 days.
Rule 701
Rule 701 under the Securities Act, as in effect on the date of this prospectus, permits resale of shares in reliance upon Rule 144
but without compliance with certain restrictions of Rule 144, including the holding period requirement. Most of our employees, executive officers or directors who purchased shares under a
written compensatory plan or contract may be entitled to rely
on the resale provisions of Rule 701, but all holders of Rule 701 shares are required to wait until 90 days after the date of this prospectus before selling their shares. However,
substantially all Rule 701 shares are subject to lock-up agreements as described below and under "Underwriting" included elsewhere in this prospectus and will become eligible for sale upon the
expiration of the restrictions set forth in those agreements.
Lock-Up Agreements
We, all of the directors and executive officers, as well as substantially all of our stockholders and holders of options and warrants, have
agreed that, without the prior written consent of Morgan Stanley and Co. LLC on behalf of the underwriters, we and they will not, during the period ending 180 days after the date
of this prospectus:
- •
- offer, pledge, sell, contract to sell, sell any option or contract to purchase, purchase any option or contract to sell, grant any option,
right or warrant to purchase, lend, or otherwise transfer or dispose of, directly or indirectly, any shares of our common stock or securities convertible into or exercisable or exchangeable for our
common stock; or
- •
- enter into any swap or other arrangement that transfers to another, in whole or in part, any of the economic consequences of ownership of our
common stock,
whether
any transaction described above is to be settled by delivery of shares of our common stock or such other securities, in cash or otherwise. This agreement is subject to certain exceptions, as
set forth in the section entitled "Underwriting."
Registration Rights
The holders of an aggregate of 43,705,690 shares of our common stock, including shares issuable upon exercise of warrants to purchase
convertible preferred stock or common stock, or
their transferees, will be entitled to certain rights with respect to the registration of the offer and sale of those shares under the Securities Act. If the offer and sale of these shares is
registered, they will generally be freely tradable without restriction under the Securities Act. For a description of these registration rights, see "Description of Capital
Stock—Registration Rights."
Registration Statement on Form S-8
We intend to file a registration statement on Form S-8 under the Securities Act promptly after the completion of this offering to
register shares of our common stock subject to options and other equity awards outstanding, as well as shares reserved for future issuance, under our equity compensation plans. The registration
statement on Form S-8 is expected to become effective immediately upon filing, and shares of our common stock covered by the registration statement will then become eligible for sale in the
public market, subject to the Rule 144 limitations applicable to affiliates, vesting restrictions and any applicable market standoff agreements and lock-up agreements. See "Executive
Compensation—Benefit Plans" for a description of our equity compensation plans.
125
Table of Contents
MATERIAL UNITED STATES FEDERAL INCOME TAX CONSEQUENCES TO NON-U.S. HOLDERS
The following is a summary of the material U.S. federal income tax consequences of the ownership and disposition of our common stock to non-U.S.
holders, but does not purport to be a complete analysis of all the potential tax considerations relating thereto. This summary is based upon the provisions of the Internal Revenue Code of 1986, as
amended, or the Code, Treasury regulations promulgated thereunder, administrative rulings and judicial decisions, all as of the date hereof. These authorities may be changed, possibly retroactively,
so as to result in U.S. federal tax consequences different from those set forth below. We have not sought any ruling from the IRS with respect to the statements made and the conclusions reached in the
following summary, and there can be no assurance that the IRS will agree with such statements and conclusions.
This
summary also does not address the tax considerations arising under the laws of any non-U.S., state or local jurisdiction or under U.S. federal gift and estate tax laws, except to
the limited extent below. In addition, this discussion does not address tax considerations applicable to an investor's particular circumstances or to investors that may be subject to special tax
rules, including, without limitation:
- •
- banks, insurance companies or other financial institutions, regulated investment companies and real estate investment trusts;
- •
- persons subject to the alternative minimum tax or net investment income tax;
- •
- tax-exempt organizations or governmental organizations;
- •
- controlled foreign corporations, passive foreign investment companies and corporations that accumulate earnings to avoid United States federal
income tax;
- •
- brokers or dealers in securities or currencies;
- •
- traders in securities that elect to use a mark-to-market method of accounting for their securities holdings;
- •
- persons that own, or are deemed to own, more than five percent of our capital stock (except to the extent specifically set forth below);
- •
- certain former citizens or long-term residents of the United States;
- •
- entities or arrangements classified as partnerships for U.S. federal income tax purposes and other pass-through entities (and investors
therein);
- •
- persons who hold our common stock as a position in a hedging transaction, "straddle," "conversion transaction" or other risk reduction
transaction;
- •
- persons who hold or receive our common stock pursuant to the exercise of any employee stock option or otherwise as compensation;
- •
- persons who do not hold our common stock as a capital asset (within the meaning of Section 1221 of the Code); or
- •
- persons deemed to sell our common stock under the constructive sale provisions of the Code.
In
addition, if a partnership or entity or arrangement classified as a partnership for U.S. federal income tax purposes holds our common stock, the tax treatment of a partner generally
will depend on the status of the partner and upon the activities of the partnership. Accordingly, partnerships that hold our common stock, and partners in such partnerships, should consult their tax
advisors.
You are urged to consult your tax advisor with respect to the application of the U.S. federal income tax laws to your particular situation, as well as any tax
consequences of the purchase, ownership and
126
Table of Contents
disposition of our common stock arising under the U.S. federal income, estate or gift tax rules or under the laws of any state, local, non-U.S. or other taxing jurisdiction or under any applicable tax
treaty.
Non-U.S. holder defined
For purposes of this discussion, you are a non-U.S. holder (other than a partnership or entity or arrangement classified as a partnership for
U.S. federal income tax purposes) if you are, for U.S. federal income tax purposes, any holder other than:
- •
- an individual citizen or resident of the United States;
- •
- a corporation or other entity taxable as a corporation created or organized in the United States or under the laws of the United States or any
political subdivision thereof;
- •
- an estate whose income is subject to U.S. federal income tax regardless of its source; or
- •
- a trust (x) whose administration is subject to the primary supervision of a U.S. court and which has one or more U.S. persons who have
the authority to control all substantial decisions of the trust or (y) which has made an election to be treated as a U.S. person.
Distributions
We have not made any distributions on our common stock, and we do not plan to make any distributions for the foreseeable future. However, if we
do make distributions on our common stock, those payments will constitute dividends for U.S. tax purposes to the extent paid from our current or accumulated earnings and profits, as determined under
U.S. federal income tax principles. To the extent those distributions exceed both our current and our accumulated earnings and profits, they will constitute a return of capital and will first reduce
your basis in our common stock, but not below zero, and then will be treated as gain from the sale of stock.
Subject
to the discussion below on effectively connected income, any dividend paid to you generally will be subject to U.S. withholding tax either at a rate of 30% of the gross amount of
the dividend or such lower rate as may be specified by an applicable income tax treaty. In order to receive a reduced treaty rate, you must provide us with an IRS Form W-8BEN, IRS
Form W-8BEN-E or other appropriate version of IRS Form W-8 certifying qualification for the reduced rate. A non-U.S. holder of shares of our common stock eligible for a reduced rate of
U.S. withholding tax pursuant to an income tax treaty may be able to obtain a refund of any excess amounts withheld by filing an appropriate claim for refund with the IRS. If the non-U.S. holder holds
the stock through a financial institution or other agent acting on the non-U.S. holder's behalf, the non-U.S. holder will be required to provide appropriate documentation to the agent, which then will
be required to provide certification to us or our paying agent, either directly or through other intermediaries.
Dividends
received by you that are effectively connected with your conduct of a U.S. trade or business (and, if required by an applicable income tax treaty, attributable to a permanent
establishment maintained by you in the United States) are generally exempt from such withholding tax. In order to obtain this exemption, you must provide us with an IRS Form W-8ECI or other
applicable IRS Form W-8 properly certifying such exemption. Such effectively connected dividends, although not subject to withholding tax, are taxed at the same graduated rates applicable to
U.S. persons, net of certain deductions and credits, subject to an applicable income tax treaty providing otherwise. In addition, if you are a corporate non-U.S. holder, dividends you receive that are
effectively connected with your conduct of a U.S. trade or business may also be subject to a branch profits tax at a rate of 30% or such lower rate as may be specified by an applicable income tax
treaty.
127
Table of Contents
Gain on disposition of common stock
Subject to the discussion below regarding backup withholding and foreign accounts, you generally will not be required to pay U.S. federal income
tax on any gain realized upon the sale or other disposition of our common stock unless:
- •
- the gain is effectively connected with your conduct of a U.S. trade or business (and, if required by an applicable income tax treaty, the gain
is attributable to a permanent establishment maintained by you in the United States);
- •
- you are an individual who is present in the United States for a period or periods aggregating 183 days or more during the calendar year
in which the sale or disposition occurs and certain other conditions are met; or
- •
- our common stock constitutes a U.S. real property interest by reason of our status as a "United States real property holding corporation" for
U.S. federal income tax purposes (a "USRPHC") at any time within the shorter of the five-year period preceding your disposition of, or your holding period for, our common stock.
We
believe that we are not currently and will not become a USRPHC. However, because the determination of whether we are a USRPHC depends on the fair market value of our U.S. real
property relative to the fair market value of our other business assets, there can be no assurance that we will not become a USRPHC in the future. Even if we become a USRPHC, however, as long as our
common stock is regularly traded on an established securities market, such common stock will be treated as U.S. real property interests only if you actually or constructively hold more than five
percent
of such regularly traded common stock at any time during the applicable period that is specified in the Code.
If
you are a non-U.S. holder described in the first bullet above, you will be required to pay tax on the net gain derived from the sale under regular graduated U.S. federal income tax
rates, and corporate non-U.S. holders described in the first bullet above may be subject to the branch profits tax at a 30% rate or such lower rate as may be specified by an applicable income tax
treaty. If you are an individual non-U.S. holder described in the second bullet above, you will be required to pay a flat 30% tax on the gain derived from the sale, which gain may be offset by U.S.
source capital losses (even though you are not considered a resident of the United States, provided you have timely filed U.S. federal income tax returns with respect to such losses). You should
consult your tax advisor regarding any applicable income tax or other treaties that may provide for different rules.
Federal estate tax
Our common stock beneficially owned by an individual who is not a citizen or resident of the United States (as defined for U.S. federal estate
tax purposes) at the time of death will generally be includable in the decedent's gross estate for U.S. federal estate tax purposes, unless an applicable estate tax treaty provides otherwise.
Backup withholding and information reporting
Generally, we must report annually to the IRS the amount of dividends paid to you, your name and address, and the amount of tax withheld, if
any. A similar report is sent to you. Pursuant to applicable income tax treaties or other agreements, the IRS may make these reports available to tax authorities in your country of residence.
Payments
of dividends or of proceeds on the disposition of stock made to you may be subject to information reporting and backup withholding at a current rate of 28% unless you establish
an exemption, for example by properly certifying your non-U.S. status on an IRS Form W-8BEN, IRS Form W-8BEN-E or another appropriate version of IRS Form W8. Notwithstanding the
foregoing, backup withholding and
128
Table of Contents
information
reporting may apply if either we or our paying agent has actual knowledge, or reason to know, that you are a U.S. person.
Backup
withholding is not an additional tax; rather, the U.S. federal income tax liability of persons subject to backup withholding will be reduced by the amount of tax withheld. If
withholding results in an overpayment of taxes, a refund or credit may generally be obtained from the IRS, provided that the required information is furnished to the IRS in a timely manner.
Foreign account tax compliance act
The Foreign Account Tax Compliance Act, or FATCA, imposes a U.S. federal withholding tax at a rate of 30% on dividends on and gross proceeds
from the sale or other disposition of our common stock paid to a "foreign financial institution" (as specially defined under these rules), unless such institution enters into an agreement with the
U.S. government to withhold on certain payments and to collect and provide to the U.S. tax authorities substantial information regarding the U.S. account holders of such institution (which includes
certain equity and debt holders of such institution, as well as certain account holders that are foreign entities with U.S. owners) or otherwise establishes an exemption. FATCA also generally imposes
a U.S. federal withholding tax of 30% on dividends on and gross proceeds from the sale or other disposition of our common stock paid to a "non-financial foreign entity" (as specially defined for
purposes of these rules) unless such entity provides the withholding agent with a certification identifying certain substantial direct and indirect U.S. owners of the entity, certifies that there are
none or otherwise establishes an exemption. The withholding provisions under FATCA generally apply to dividends on our common stock, and under current transition rules, are expected to apply with
respect to the gross proceeds from the sale or other disposition of our common stock on or after January 1, 2019. An intergovernmental agreement between the United States and an applicable
foreign country may modify the requirements described in this paragraph. Non-U.S. holders should consult their own tax advisors regarding the possible implications of this legislation on their
investment in our common stock.
The preceding discussion of U.S. federal income tax considerations is for general information only. It is not tax advice. Each prospective investor should consult
its own tax advisor regarding the particular U.S. federal, state and local and non-U.S. tax consequences of purchasing, holding and disposing of our common stock, including the consequences of any
proposed change in applicable laws.
129
Table of Contents
UNDERWRITING
Under the terms and subject to the conditions in an underwriting agreement dated the date of this prospectus, the underwriters named below, for
whom Morgan Stanley & Co. LLC, J.P. Morgan Securities LLC and RBC Capital Markets, LLC are acting as representatives, have severally
agreed to purchase, and we have agreed to sell to them, severally, the number of shares indicated below:
|
|
|
|
|
Name
|
|
Number of Shares |
|
Morgan Stanley & Co. LLC |
|
|
4,200,000 |
|
J.P. Morgan Securities LLC |
|
|
3,360,000 |
|
RBC Capital Markets, LLC |
|
|
1,260,000 |
|
Pacific Crest Securities, a division of KeyBanc Capital Markets Inc. |
|
|
840,000 |
|
Piper Jaffray & Co. |
|
|
840,000 |
|
|
|
|
|
|
|
Total |
|
|
10,500,000 |
|
|
|
|
|
|
|
|
|
|
|
|
|
|
|
|
|
|
|
The
underwriters and the representatives are collectively referred to as the "underwriters" and the "representatives," respectively. The underwriters are offering the shares of common
stock subject to their acceptance of the shares from us and subject to prior sale. The underwriting agreement provides that the obligations of the several underwriters to pay for and accept delivery
of the shares of common stock offered by this prospectus are subject to the approval of certain legal matters by their counsel and to certain other conditions. The underwriters are obligated to take
and pay for all of the shares of common stock offered by this prospectus if any such shares are taken. However, the underwriters are not required to take or pay for the shares covered by the
underwriters' over-allotment option described below.
The
underwriters initially propose to offer part of the shares of common stock directly to the public at the offering price listed on the cover page of this prospectus and part to
certain dealers. After the initial offering of the shares of common stock, the offering price and other selling terms may from time to time be varied by the representatives.
We
have granted to the underwriters an option, exercisable for 30 days from the date of this prospectus, to purchase up to 1,575,000 additional shares of common stock at the
public offering price listed on the cover page of this prospectus, less underwriting discounts and commissions. The underwriters may exercise this option solely for the purpose of covering
over-allotments, if any, made in connection with the offering of the shares of common stock offered by this prospectus. To the extent the option is exercised, each underwriter will become obligated,
subject to certain conditions, to purchase about the same percentage of the additional shares of common stock as the number listed next to the underwriter's name in the preceding table bears to the
total number of shares of common stock listed next to the names of all underwriters in the preceding table.
The
following table shows the per share and total public offering price, underwriting discounts and commissions, and proceeds before expenses to us. These amounts are shown assuming both
no exercise and full exercise of the underwriters' option to purchase up to an additional 1,575,000 shares of common stock.
|
|
|
|
|
|
|
|
|
|
|
|
|
|
|
Total |
|
|
|
Per
Share |
|
|
|
No Exercise |
|
Full Exercise |
|
Public offering price |
|
$ |
11.00 |
|
$ |
115,500,000 |
|
$ |
132,825,000 |
|
Underwriting discounts and commissions to be paid by us |
|
$ |
0.77 |
|
$ |
8,085,000 |
|
$ |
9,297,750 |
|
Proceeds, before expenses, to us |
|
$ |
10.23 |
|
$ |
107,415,000 |
|
$ |
123,527,250 |
|
The
estimated offering expenses payable by us, exclusive of the underwriting discounts and commissions, are approximately $4.4 million. We have agreed to reimburse the
underwriters for expenses
130
Table of Contents
relating
to clearance of this offering with the Financial Industry Regulatory Authority up to $30,000. The underwriters have agreed to reimburse us for certain expenses incurred by us in connection
with this offering.
The
underwriters have informed us that they do not intend sales to discretionary accounts to exceed 5% of the total number of shares of common stock offered by them.
Our
common stock has been authorized for listing on the New York Stock Exchange under the trading symbol "YEXT."
We
and all directors and officers and substantially all of our stockholders and holders of options and warrants have agreed that, without the prior written consent of Morgan
Stanley & Co. LLC on behalf of the underwriters, we and they will not, during the period ending 180 days after the date of this prospectus, which we refer to as the
restricted period:
- •
- offer, pledge, sell, contract to sell, sell any option or contract to purchase, purchase any option or contract to sell, grant any option,
right or warrant to purchase, lend or otherwise transfer or dispose of, directly or indirectly, any shares of common stock or any securities convertible into or exercisable or exchangeable for shares
of common stock;
- •
- file any registration statement with the Securities and Exchange Commission relating to the offering of any shares of common stock or any
securities convertible into or exercisable or exchangeable for common stock; or
- •
- enter into any swap or other arrangement that transfers to another, in whole or in part, any of the economic consequences of ownership of the
common stock,
whether
any such transaction described above is to be settled by delivery of common stock or such other securities, in cash or otherwise. In addition, we and each such person agrees that, without the
prior written consent of Morgan Stanley & Co. LLC on behalf of the underwriters, we or such other person will not, during the restricted period, make any demand for, or exercise
any right with respect to, the registration of any shares of common stock or any security convertible into or exercisable or exchangeable for common stock.
The
lock-up restrictions described in the immediately preceding paragraph to do not apply to our directors, officers and substantially all of our stockholders and holders of options and
warrants with respect to:
- •
- the sale of shares to the underwriters;
- •
- the issuance by us of shares of common stock upon the exercise of an option or a warrant or the conversion of a security outstanding on the
date of this prospectus of which the underwriters have been advised in writing;
- •
- transactions by any person other than us relating to shares of common stock or other securities acquired in open market transactions after the
completion of the offering of the shares, provided that no filing under Section 16(a) of the Exchange Act is required or voluntarily made in connection with subsequent sales of the common stock
or other securities acquired in such open market transactions;
- •
- transfers of shares of our common stock or any security convertible into our common stock to an immediate family member of the party subject to
the lock-up agreement or as a bona fide gift;
- •
- distributions of shares of our common stock or any security convertible into our common stock to limited partners or stockholders of the party
subject to the lock-up agreement;
- •
- transfers of shares of our common stock or any security convertible into our common stock pursuant to a domestic relations order, divorce
decree or court order;
131
Table of Contents
- •
- transfers of shares of our common stock or any security convertible into our common stock to us in connection with the repurchase of shares of
our common stock issued pursuant to any employee benefit plans;
- •
- dispositions of shares of our common stock to us, or our withholding of shares of our common stock, in a transaction exempt from
Section 16(b) of the Exchange Act solely in connection with the payment of taxes due with respect to the vesting or expiration of options or the vesting of restricted stock units;
- •
- the establishment of a trading plan pursuant to Rule 10b5-1 under the Exchange Act for the transfer of shares of common stock, provided
that (i) such plan does not provide for the transfer of common stock during the restricted period and (ii) to the extent a public announcement or filing under the Exchange Act, if any,
is required or voluntarily made regarding the establishment of such plan, such announcement or filing shall include a statement to the effect that no transfer of common stock may be made under such
plan during the restricted period; or
- •
- the sale or issuance of or entry into an agreement to sell or issue shares of our common stock or any securities convertible into or
exercisable or exchangeable for shares of our common stock in connection with one or more mergers; acquisitions of securities, businesses, property or other assets, products or technologies; joint
ventures; commercial relationships or other strategic corporate transactions or alliances; provided that the aggregate amounts of such securities that we may sell or issue or agree to sell or issue
shall not exceed 5% of the total number of shares of our common stock issued and outstanding immediately following the completion of this offering; and provided further that the recipient of such
securities enters into a lock-up agreement with the underwriters for the remainder of the restricted period.
Morgan
Stanley & Co. LLC, in its sole discretion, may release the common stock and other securities subject to the lock-up agreements described above in whole or in
part at any time.
In
order to facilitate the offering of the common stock, the underwriters may engage in transactions that stabilize, maintain or otherwise affect the price of the common stock.
Specifically, the underwriters may sell more shares than they are obligated to purchase under the underwriting agreement, creating a short position. A short sale is covered if the short position is no
greater than the number of shares available for purchase by the underwriters under the option. The underwriters can close out a covered short sale by exercising the option or purchasing shares in the
open market. In determining the source of shares to close out a covered short sale, the underwriters will consider, among other things, the open
market price of shares compared to the price available under the option. The underwriters may also sell shares in excess of the option, creating a naked short position. The underwriters must close out
any naked short position by purchasing shares in the open market. A naked short position is more likely to be created if the underwriters are concerned that there may be downward pressure on the price
of the common stock in the open market after pricing that could adversely affect investors who purchase in this offering. As an additional means of facilitating this offering, the underwriters may bid
for, and purchase, shares of common stock in the open market to stabilize the price of the common stock. These activities may raise or maintain the market price of the common stock above independent
market levels or prevent or retard a decline in the market price of the common stock. The underwriters are not required to engage in these activities and may end any of these activities at any time.
We
and the underwriters have agreed to indemnify each other against certain liabilities, including liabilities under the Securities Act.
A
prospectus in electronic format may be made available on websites maintained by one or more underwriters, or selling group members, if any, participating in this offering. The
representatives may agree to allocate a number of shares of common stock to underwriters for sale to their online brokerage account
132
Table of Contents
holders.
Internet distributions will be allocated by the representatives to underwriters that may make Internet distributions on the same basis as other allocations.
Other Relationships
The underwriters and their respective affiliates are full service financial institutions engaged in various activities, which may include
securities trading, commercial and investment banking, financial advisory, investment management, investment research, principal investment, hedging, financing and brokerage activities. Certain of the
underwriters and their respective affiliates have, from time to time, performed, and may in the future perform, various financial advisory and investment banking services for us, for which they
received or will receive customary fees and expenses.
In
addition, in the ordinary course of their various business activities, the underwriters and their respective affiliates may make or hold a broad array of investments and actively
trade debt and equity securities (or related derivative securities) and financial instruments (including bank loans) for their own account and for the accounts of their customers and may at any time
hold long and short positions in such securities and instruments. Such investment and securities activities may involve our securities and instruments. The underwriters and their respective affiliates
may also make investment recommendations or publish or express independent research views in respect of such securities or instruments and may at any time hold, or recommend to clients that they
acquire, long or short positions in such securities and instruments.
Pricing of the Offering
Prior to this offering, there has been no public market for our common stock. The initial public offering price has been determined by
negotiations between us and the representatives. Among the factors considered in determining the initial public offering price were our future prospects and those of our industry in general, our
sales, earnings and certain other financial and operating information in recent periods, and the price-earnings ratios, price-sales ratios, market prices of securities, and certain financial and
operating information of companies engaged in activities similar to ours.
Selling Restrictions
Canada
The shares of our common stock may be sold only to purchasers purchasing, or deemed to be purchasing, as principal that are accredited
investors, as defined in National Instrument 45-106 Prospectus Exemptions or subsection 73.3(1) of the Securities Act (Ontario), and are permitted clients, as defined in National
Instrument 31-103 Registration Requirements, Exemptions and Ongoing Registrant Obligations. Any resale of the shares must be made in accordance with an exemption from, or in a transaction not
subject to, the prospectus requirements of applicable securities laws.
Securities
legislation in certain provinces or territories of Canada may provide a purchaser with remedies for rescission or damages if this prospectus (including any amendment thereto)
contains a misrepresentation, provided that the remedies for rescission or damages are exercised by the purchaser within the time limit prescribed by the securities legislation of the purchaser's
province or territory. The purchaser should refer to any applicable provisions of the securities legislation of the purchaser's province or territory for particulars of these rights or consult with a
legal advisor.
Pursuant
to section 3A.3 (or, in the case of securities issued or guaranteed by the government of a non-Canadian jurisdiction, section 3A.4) of National
Instrument 33-105 Underwriting Conflicts (NI 33-105), the underwriters are not required to comply with the disclosure requirements of NI 33-105 regarding underwriter conflicts of
interest in connection with this offering.
133
Table of Contents
European Economic Area
In relation to each Member State of the European Economic Area which has implemented the Prospectus Directive, or a Relevant Member State, an
offer to the public of any shares of our common stock may not be made in that Relevant Member State, except that an offer to the public in that Relevant Member State of any shares of our common stock
may be made at any time under the following exemptions under the Prospectus Directive, if they have been implemented in that Relevant Member State:
- •
- to any legal entity which is a qualified investor as defined in the Prospectus Directive;
- •
- to fewer than 100 or, if the Relevant Member State has implemented the relevant provision of the 2010 PD Amending Directive, 150, natural or
legal persons (other than qualified investors as defined in the Prospectus Directive), as permitted under the Prospectus Directive, subject to obtaining the prior consent of the representatives for
any such offer; or
- •
- in any other circumstances falling within Article 3(2) of the Prospectus Directive, provided that no such offer of shares of our common
stock shall result in a requirement for the publication by us or any underwriter of a prospectus pursuant to Article 3 of the Prospectus Directive.
For
the purposes of this provision, the expression an "offer to the public" in relation to any shares of our common stock in any Relevant Member State means the communication in any form
and by any means of sufficient information on the terms of the offer and any shares of our common stock to be offered so as to enable an investor to decide to purchase any shares of our common stock,
as the same may be varied in that Member State by any measure implementing the Prospectus Directive in that Member State, the expression "Prospectus Directive" means Directive 2003/71/EC (and
amendments thereto, including the 2010 PD Amending Directive, to the extent implemented in the Relevant Member State), and includes any relevant implementing measure in the Relevant Member State, and
the expression "2010 PD Amending Directive" means Directive 2010/73/EU.
United Kingdom
Each underwriter has represented and agreed that:
- •
- it has only communicated or caused to be communicated and will only communicate or cause to be communicated an invitation or inducement to
engage in investment activity (within the meaning of Section 21 of the Financial Services and Markets Act 2000, or FSMA, received by it in connection with the issue or sale of the shares of our
common stock in circumstances in which Section 21(1) of the FSMA does not apply to us; and
- •
- it has complied and will comply with all applicable provisions of the FSMA with respect to anything done by it in relation to the shares of our
common stock in, from or otherwise involving the United Kingdom.
134
Table of Contents
LEGAL MATTERS
The validity of the shares of common stock offered hereby has been passed upon for Yext, Inc. by Wilson Sonsini Goodrich & Rosati,
Professional Corporation, New York, NY. The underwriters have been represented in connection with this offering by Cooley LLP, Washington, D.C. As of the date of this prospectus, GC&H
Investments, LLC and GC&H Investments, entities comprised of partners and associates of Cooley LLP, beneficially own shares of our convertible preferred stock that will automatically
convert into an aggregate of 21,684 shares of our common stock upon the closing of this offering.
EXPERTS
Ernst & Young LLP, independent registered public accounting firm, has audited our consolidated financial statements for the fiscal
years ended January 31, 2015, 2016 and 2017, as set forth in their report. We have included our financial statements in the prospectus and elsewhere in the registration statement in reliance on
Ernst & Young LLP's report, given on their authority as experts in accounting and auditing.
WHERE YOU CAN FIND MORE INFORMATION
We have filed a registration statement on Form S-1 with the SEC for the common stock we are offering pursuant to this prospectus. This
prospectus does not include all of the information contained in the registration statement. You should refer to the registration statement and its exhibits for additional information. Whenever we make
reference in this prospectus to any of our contracts, agreements or other documents, the references are summaries and are not necessarily complete and you should refer to the exhibits attached to the
registration statement for copies of the actual contract, agreement or other document.
You
can read our SEC filings, including the registration statement, over the Internet at the SEC's website at www.sec.gov. You may also read and copy any document we file with the SEC at
its public reference facilities at 100 F Street, N.E., Room 1580, Washington, D.C. 20549. You may also obtain copies of the documents at prescribed rates by writing to the Public
Reference Section of the SEC at 100 F Street, N.E., Room 1580, Washington, D.C. 20549. Please call the SEC at 1-800-SEC-0330 for further information on the operation of the public
reference facilities.
As
a result of this offering, we will become subject to the information and reporting requirements of the Exchange Act and, in accordance with this law, will file periodic reports, proxy
statements and other information with the SEC. These periodic reports, proxy statements and other information will be available for inspection and copying at the public reference facilities and
website of the SEC referred to above. We also maintain a website at www.yext.com where, upon completion of this offering, you may access these materials free of charge as soon as reasonably
practicable after they are electronically filed with, or furnished to, the SEC. The information on or that can be accessed through our website is not a part of this prospectus or the registration
statement of which this prospectus forms a part, and the inclusion of our website address in this prospectus is an inactive textual reference only.
135
Table of Contents
INDEX TO CONSOLIDATED FINANCIAL STATEMENTS
F-1
Table of Contents
REPORT OF INDEPENDENT REGISTERED PUBLIC ACCOUNTING FIRM
The
Board of Directors
Yext, Inc.
We
have audited the accompanying consolidated balance sheets of Yext, Inc. as of January 31, 2016 and 2017, and the related consolidated statements of operations and
comprehensive loss, convertible preferred stock and stockholders' deficit and cash flows for each of the three years in the period ended January 31, 2017. These consolidated financial
statements are the responsibility of the Company's management. Our responsibility is to express an opinion on these consolidated financial statements based on our audits.
We
conducted our audits in accordance with the auditing standards of the Public Company Accounting Oversight Board (United States). Those standards require that we plan and perform the
audit to obtain reasonable assurance about whether the financial statements are free of material misstatement. An audit includes examining, on a test basis, evidence supporting the amounts and
disclosures in the financial statements. An audit also includes assessing the accounting principles used and significant estimates made by management, as well as evaluating the overall financial
statement presentation. We believe that our audits provide a reasonable basis for our opinion.
In
our opinion, the financial statements referred to above present fairly, in all material respects, the consolidated financial position of Yext, Inc. at January 31, 2016
and 2017, and the consolidated results of operations and its cash flows for each of the three years in the period ended January 31, 2017 in conformity with U.S. generally accepted accounting
principles.
New
York, New York
March 17, 2017
F-2
Table of Contents
YEXT, INC.
CONSOLIDATED BALANCE SHEETS
(In thousands, except share and per share amounts)
|
|
|
|
|
|
|
|
|
|
|
|
|
January 31, |
|
Pro Forma
as of
January 31,
2017 |
|
|
|
2016 |
|
2017 |
|
|
|
|
|
|
|
(unaudited)
|
|
Assets |
|
|
|
|
|
|
|
|
|
|
Current assets: |
|
|
|
|
|
|
|
|
|
|
Cash and cash equivalents |
|
$ |
30,028 |
|
$ |
24,420 |
|
$ |
24,420 |
|
Accounts receivable, net of allowance of $516, and $189, respectively |
|
|
24,182 |
|
|
27,646 |
|
|
27,646 |
|
Deferred commissions |
|
|
2,156 |
|
|
6,252 |
|
|
6,252 |
|
Prepaid expenses and other current assets |
|
|
1,790 |
|
|
3,511 |
|
|
3,511 |
|
|
|
|
|
|
|
|
|
|
|
|
|
Total current assets |
|
|
58,156 |
|
|
61,829 |
|
|
61,829 |
|
Property and equipment, net |
|
|
11,958 |
|
|
11,613 |
|
|
11,613 |
|
Restricted cash |
|
|
6,289 |
|
|
500 |
|
|
500 |
|
Intangible assets, net |
|
|
4,090 |
|
|
3,128 |
|
|
3,128 |
|
Goodwill |
|
|
4,479 |
|
|
4,444 |
|
|
4,444 |
|
Other long term assets |
|
|
525 |
|
|
4,951 |
|
|
4,951 |
|
|
|
|
|
|
|
|
|
|
|
|
|
Total assets |
|
$ |
85,497 |
|
$ |
86,465 |
|
$ |
86,465 |
|
|
|
|
|
|
|
|
|
|
|
|
|
|
|
|
|
|
|
|
|
|
|
|
|
|
|
|
|
|
|
|
|
|
|
|
|
Liabilities, convertible preferred stock, and stockholders' deficit |
|
|
|
|
|
|
|
|
|
|
Current liabilities: |
|
|
|
|
|
|
|
|
|
|
Accounts payable, accrued expenses and other current liabilities |
|
$ |
17,547 |
|
$ |
25,633 |
|
$ |
24,689 |
|
Deferred revenue |
|
|
35,954 |
|
|
57,112 |
|
|
57,112 |
|
Deferred rent |
|
|
930 |
|
|
936 |
|
|
936 |
|
|
|
|
|
|
|
|
|
|
|
|
|
Total current liabilities |
|
|
54,431 |
|
|
83,681 |
|
|
82,737 |
|
Deferred rent, non-current |
|
|
4,944 |
|
|
4,348 |
|
|
4,348 |
|
Long term debt |
|
|
— |
|
|
5,000 |
|
|
5,000 |
|
Other long term liabilities |
|
|
607 |
|
|
408 |
|
|
408 |
|
Deferred tax liability |
|
|
136 |
|
|
168 |
|
|
168 |
|
|
|
|
|
|
|
|
|
|
|
|
|
Total liabilities |
|
|
60,118 |
|
|
93,605 |
|
|
92,661 |
|
Commitments and contingencies (Note 11) |
|
|
|
|
|
|
|
|
|
|
Convertible preferred stock, $0.001 par value per share; 43,705,690 shares authorized, actual and pro forma; 43,594,753
shares issued and outstanding, actual; no shares issued or outstanding, pro forma (unaudited) |
|
|
120,615 |
|
|
120,615 |
|
|
— |
|
Stockholders' deficit |
|
|
|
|
|
|
|
|
|
|
Common stock, $0.001 par value per share; 100,294,750 and 200,000,000 shares authorized at January 31, 2016 and 2017,
respectively; 37,282,281 and 37,900,051 shares issued at January 31, 2016 and 2017, respectively; 30,776,947 and 31,394,717 shares outstanding at January 31, 2016 and 2017, respectively; 200,000,000 shares authorized, pro forma (unaudited);
81,494,804 shares issued, pro forma (unaudited); 74,989,470 shares outstanding, pro forma (unaudited) |
|
|
37 |
|
|
38 |
|
|
82 |
|
Additional paid-in capital |
|
|
41,634 |
|
|
52,805 |
|
|
174,320 |
|
Accumulated other comprehensive loss |
|
|
(1,267 |
) |
|
(1,808 |
) |
|
(1,808 |
) |
Accumulated deficit |
|
|
(123,735 |
) |
|
(166,885 |
) |
|
(166,885 |
) |
Treasury stock, at cost |
|
|
(11,905 |
) |
|
(11,905 |
) |
|
(11,905 |
) |
|
|
|
|
|
|
|
|
|
|
|
|
Total stockholders' deficit |
|
|
(95,236 |
) |
|
(127,755 |
) |
|
(6,196 |
) |
|
|
|
|
|
|
|
|
|
|
|
|
Total liabilities and stockholders' deficit |
|
$ |
85,497 |
|
$ |
86,465 |
|
$ |
86,465 |
|
|
|
|
|
|
|
|
|
|
|
|
|
|
|
|
|
|
|
|
|
|
|
|
|
|
|
|
|
|
|
|
|
|
|
|
|
The accompanying notes are an integral part of these consolidated financial statements.
F-3
Table of Contents
YEXT, INC.
CONSOLIDATED STATEMENTS OF OPERATIONS AND COMPREHENSIVE LOSS
(In thousands, except share and per share amounts)
|
|
|
|
|
|
|
|
|
|
|
|
|
Fiscal year ended
January 31, |
|
|
|
2015 |
|
2016 |
|
2017 |
|
Revenues |
|
$ |
60,002 |
|
$ |
89,724 |
|
$ |
124,261 |
|
Cost of revenues |
|
|
24,832 |
|
|
31,033 |
|
|
36,950 |
|
|
|
|
|
|
|
|
|
|
|
|
|
Gross profit |
|
|
35,170 |
|
|
58,691 |
|
|
87,311 |
|
Operating expenses: |
|
|
|
|
|
|
|
|
|
|
Sales and marketing |
|
|
31,588 |
|
|
49,822 |
|
|
81,529 |
|
Research and development |
|
|
11,945 |
|
|
16,201 |
|
|
19,316 |
|
General and administrative |
|
|
8,988 |
|
|
18,806 |
|
|
29,166 |
|
|
|
|
|
|
|
|
|
|
|
|
|
Total operating expenses |
|
|
52,521 |
|
|
84,829 |
|
|
130,011 |
|
|
|
|
|
|
|
|
|
|
|
|
|
Loss from operations |
|
|
(17,351 |
) |
|
(26,138 |
) |
|
(42,700 |
) |
Other income (expense), net |
|
|
78 |
|
|
(412 |
) |
|
(382 |
) |
|
|
|
|
|
|
|
|
|
|
|
|
Loss from operations before income taxes |
|
|
(17,273 |
) |
|
(26,550 |
) |
|
(43,082 |
) |
Benefit from (provision for) income taxes |
|
|
— |
|
|
55 |
|
|
(68 |
) |
|
|
|
|
|
|
|
|
|
|
|
|
Net loss |
|
$ |
(17,273 |
) |
$ |
(26,495 |
) |
$ |
(43,150 |
) |
|
|
|
|
|
|
|
|
|
|
|
|
|
|
|
|
|
|
|
|
|
|
|
|
|
|
|
|
|
|
|
|
|
|
|
|
Net loss per share attributable to common stockholders, basic and diluted |
|
$ |
(0.61 |
) |
$ |
(0.89 |
) |
$ |
(1.39 |
) |
|
|
|
|
|
|
|
|
|
|
|
|
|
|
|
|
|
|
|
|
|
|
|
|
|
|
|
|
|
|
|
|
|
|
|
|
Weighted-average number of shares used in computing net loss per share attributable to common stockholders, basic and
diluted |
|
|
28,519,917 |
|
|
29,917,814 |
|
|
31,069,695 |
|
|
|
|
|
|
|
|
|
|
|
|
|
|
|
|
|
|
|
|
|
|
|
|
|
|
|
|
|
|
|
|
|
|
|
|
|
Pro forma net loss per share attributable to common stockholders, basic and diluted (unaudited) |
|
|
|
|
|
|
|
$ |
(0.58 |
) |
|
|
|
|
|
|
|
|
|
|
|
|
|
|
|
|
|
|
|
|
|
|
|
|
|
|
|
|
|
|
|
|
|
|
|
|
Weighted-average number of shares used in computing pro forma net loss per share attributable to common stockholders,
basic and diluted (unaudited) |
|
|
|
|
|
|
|
|
74,664,448 |
|
|
|
|
|
|
|
|
|
|
|
|
|
|
|
|
|
|
|
|
|
|
|
|
|
|
|
|
|
|
|
|
|
|
|
|
|
Other comprehensive loss: |
|
|
|
|
|
|
|
|
|
|
Foreign currency translation adjustment |
|
$ |
(807 |
) |
$ |
(460 |
) |
$ |
(541 |
) |
|
|
|
|
|
|
|
|
|
|
|
|
Total comprehensive loss |
|
$ |
(18,080 |
) |
$ |
(26,955 |
) |
$ |
(43,691 |
) |
|
|
|
|
|
|
|
|
|
|
|
|
|
|
|
|
|
|
|
|
|
|
|
|
|
|
|
|
|
|
|
|
|
|
|
|
The accompanying notes are an integral part of these consolidated financial statements.
F-4
Table of Contents
YEXT, INC.
CONSOLIDATED STATEMENTS OF CONVERTIBLE PREFERRED STOCK
AND STOCKHOLDERS' DEFICIT
(In thousands)
|
|
|
|
|
|
|
|
|
|
|
|
|
|
|
|
|
|
|
|
|
|
|
|
|
|
|
|
|
|
|
|
|
Convertible
Preferred Stock |
|
|
|
|
|
|
|
|
|
|
|
|
|
|
|
|
|
|
|
|
|
Common Stock |
|
|
|
Accumulated
Other
Comprehensive
Income |
|
|
|
|
|
|
|
|
|
|
|
Additional
Paid-In
Capital |
|
Accumulated
Deficit |
|
Treasury
Stock |
|
Total
Stockholders'
Deficit |
|
|
|
Shares |
|
Amount |
|
|
|
Shares |
|
Amount |
|
Balance, January 31, 2014 |
|
|
34,952 |
|
$ |
70,532 |
|
|
|
|
28,359 |
|
$ |
35 |
|
$ |
5,976 |
|
$ |
— |
|
$ |
(56,445 |
) |
$ |
(11,905 |
) |
$ |
(62,339 |
) |
Issuance of common stock for acquisition |
|
|
— |
|
|
— |
|
|
|
|
730 |
|
|
1 |
|
|
2,801 |
|
|
— |
|
|
— |
|
|
— |
|
|
2,802 |
|
Exercise of stock options |
|
|
— |
|
|
— |
|
|
|
|
154 |
|
|
— |
|
|
279 |
|
|
— |
|
|
— |
|
|
— |
|
|
279 |
|
Share-based compensation |
|
|
— |
|
|
— |
|
|
|
|
— |
|
|
— |
|
|
2,903 |
|
|
— |
|
|
— |
|
|
— |
|
|
2,903 |
|
Issuance of Series F preferred stock |
|
|
8,642 |
|
|
50,083 |
|
|
|
|
— |
|
|
— |
|
|
— |
|
|
— |
|
|
— |
|
|
— |
|
|
— |
|
Other comprehensive loss |
|
|
— |
|
|
— |
|
|
|
|
— |
|
|
— |
|
|
— |
|
|
(807 |
) |
|
— |
|
|
— |
|
|
(807 |
) |
Net loss |
|
|
— |
|
|
— |
|
|
|
|
— |
|
|
— |
|
|
— |
|
|
— |
|
|
(17,273 |
) |
|
— |
|
|
(17,273 |
) |
|
|
|
|
|
|
|
|
|
|
|
|
|
|
|
|
|
|
|
|
|
|
|
|
|
|
|
|
|
|
|
|
Balance, January 31, 2015 |
|
|
43,594 |
|
|
120,615 |
|
|
|
|
29,243 |
|
|
36 |
|
|
11,959 |
|
|
(807 |
) |
|
(73,718 |
) |
|
(11,905 |
) |
|
(74,435 |
) |
Issuance of common stock for acquisitions |
|
|
— |
|
|
— |
|
|
|
|
81 |
|
|
— |
|
|
— |
|
|
— |
|
|
— |
|
|
— |
|
|
— |
|
Exercise of stock options |
|
|
— |
|
|
— |
|
|
|
|
263 |
|
|
— |
|
|
449 |
|
|
— |
|
|
— |
|
|
— |
|
|
449 |
|
Share repurchase and stock option settlement |
|
|
— |
|
|
— |
|
|
|
|
(4,705 |
) |
|
(5 |
) |
|
(4,756 |
) |
|
— |
|
|
(23,522 |
) |
|
— |
|
|
(28,283 |
) |
Proceeds from the sale of common stock |
|
|
— |
|
|
— |
|
|
|
|
5,895 |
|
|
6 |
|
|
29,475 |
|
|
— |
|
|
— |
|
|
— |
|
|
29,481 |
|
Share-based compensation |
|
|
— |
|
|
— |
|
|
|
|
— |
|
|
— |
|
|
4,507 |
|
|
— |
|
|
— |
|
|
— |
|
|
4,507 |
|
Other comprehensive loss |
|
|
— |
|
|
— |
|
|
|
|
— |
|
|
— |
|
|
— |
|
|
(460 |
) |
|
— |
|
|
— |
|
|
(460 |
) |
Other |
|
|
— |
|
|
|
|
|
|
|
— |
|
|
— |
|
|
— |
|
|
— |
|
|
|
|
|
— |
|
|
— |
|
Net loss |
|
|
— |
|
|
— |
|
|
|
|
— |
|
|
— |
|
|
— |
|
|
— |
|
|
(26,495 |
) |
|
— |
|
|
(26,495 |
) |
|
|
|
|
|
|
|
|
|
|
|
|
|
|
|
|
|
|
|
|
|
|
|
|
|
|
|
|
|
|
|
|
Balance, January 31, 2016 |
|
|
43,594 |
|
|
120,615 |
|
|
|
|
30,777 |
|
|
37 |
|
|
41,634 |
|
|
(1,267 |
) |
|
(123,735 |
) |
|
(11,905 |
) |
|
(95,236 |
) |
Exercise of stock options |
|
|
— |
|
|
— |
|
|
|
|
618 |
|
|
1 |
|
|
1,320 |
|
|
— |
|
|
— |
|
|
— |
|
|
1,321 |
|
Share-based compensation |
|
|
— |
|
|
— |
|
|
|
|
— |
|
|
— |
|
|
9,851 |
|
|
— |
|
|
— |
|
|
— |
|
|
9,851 |
|
Other comprehensive loss |
|
|
— |
|
|
— |
|
|
|
|
— |
|
|
— |
|
|
— |
|
|
(541 |
) |
|
— |
|
|
— |
|
|
(541 |
) |
Net loss |
|
|
— |
|
|
— |
|
|
|
|
— |
|
|
— |
|
|
— |
|
|
— |
|
|
(43,150 |
) |
|
— |
|
|
(43,150 |
) |
|
|
|
|
|
|
|
|
|
|
|
|
|
|
|
|
|
|
|
|
|
|
|
|
|
|
|
|
|
|
|
|
Balance, January 31, 2017 |
|
|
43,594 |
|
$ |
120,615 |
|
|
|
|
31,395 |
|
$ |
38 |
|
$ |
52,805 |
|
$ |
(1,808 |
) |
$ |
(166,885 |
) |
$ |
(11,905 |
) |
$ |
(127,755 |
) |
|
|
|
|
|
|
|
|
|
|
|
|
|
|
|
|
|
|
|
|
|
|
|
|
|
|
|
|
|
|
|
|
|
|
|
|
|
|
|
|
|
|
|
|
|
|
|
|
|
|
|
|
|
|
|
|
|
|
|
|
|
|
|
|
|
|
|
|
|
|
|
|
|
|
|
|
|
|
|
|
|
|
|
|
|
|
|
|
|
|
|
|
|
|
|
|
The accompanying notes are an integral part of these consolidated financial statements.
F-5
Table of Contents
YEXT, INC.
CONSOLIDATED STATEMENTS OF CASH FLOWS
(In thousands)
|
|
|
|
|
|
|
|
|
|
|
|
|
Fiscal year ended
January 31, |
|
|
|
2015 |
|
2016 |
|
2017 |
|
Operating activities |
|
|
|
|
|
|
|
|
|
|
Net loss |
|
$ |
(17,273 |
) |
$ |
(26,495 |
) |
$ |
(43,150 |
) |
Adjustments to reconcile net loss to net cash used in operating activities: |
|
|
|
|
|
|
|
|
|
|
Depreciation and amortization |
|
|
1,193 |
|
|
3,106 |
|
|
4,082 |
|
Provision for bad debts |
|
|
123 |
|
|
582 |
|
|
653 |
|
Share-based compensation |
|
|
2,903 |
|
|
4,507 |
|
|
9,851 |
|
Change in fair value of warrant liabilities |
|
|
(66 |
) |
|
387 |
|
|
253 |
|
Deferred income taxes |
|
|
— |
|
|
(1,057 |
) |
|
31 |
|
Amortization of deferred financing costs |
|
|
— |
|
|
— |
|
|
104 |
|
Changes in operating assets and liabilities: |
|
|
|
|
|
|
|
|
|
|
Accounts receivable |
|
|
(4,952 |
) |
|
(12,144 |
) |
|
(4,117 |
) |
Prepaid expenses and other current assets |
|
|
(1,053 |
) |
|
(231 |
) |
|
(1,642 |
) |
Restricted cash |
|
|
(3,469 |
) |
|
(1,002 |
) |
|
5,789 |
|
Deferred commissions |
|
|
(242 |
) |
|
(1,531 |
) |
|
(5,573 |
) |
Other long term assets |
|
|
— |
|
|
(150 |
) |
|
(430 |
) |
Accounts payable, accrued expenses and other current liabilities |
|
|
1,052 |
|
|
8,269 |
|
|
6,037 |
|
Other long term liabilities |
|
|
— |
|
|
233 |
|
|
17 |
|
Deferred revenue |
|
|
6,946 |
|
|
12,856 |
|
|
20,942 |
|
Deferred rent |
|
|
612 |
|
|
2,145 |
|
|
(590 |
) |
|
|
|
|
|
|
|
|
|
|
|
|
Net cash used in operating activities |
|
|
(14,226 |
) |
|
(10,525 |
) |
|
(7,743 |
) |
Investing activities |
|
|
|
|
|
|
|
|
|
|
Capital expenditures |
|
|
(1,922 |
) |
|
(9,759 |
) |
|
(3,505 |
) |
Acquisitions, net of cash acquired |
|
|
(5,914 |
) |
|
(150 |
) |
|
— |
|
Purchase of intangible assets |
|
|
— |
|
|
(96 |
) |
|
(298 |
) |
|
|
|
|
|
|
|
|
|
|
|
|
Net cash used in investing activities |
|
|
(7,836 |
) |
|
(10,005 |
) |
|
(3,803 |
) |
Financing activities |
|
|
|
|
|
|
|
|
|
|
Proceeds from borrowings on Revolving Line |
|
|
— |
|
|
— |
|
|
5,000 |
|
Proceeds from exercise of stock options |
|
|
279 |
|
|
449 |
|
|
1,321 |
|
Proceeds from issuance of Series F preferred stock, net of issuance costs(1) |
|
|
50,083 |
|
|
— |
|
|
— |
|
Share repurchase and stock option settlement |
|
|
— |
|
|
(28,283 |
) |
|
— |
|
Proceeds from the sale of common stock |
|
|
— |
|
|
29,481 |
|
|
— |
|
Payments of deferred offering costs |
|
|
— |
|
|
— |
|
|
(170 |
) |
Payments of deferred financing costs |
|
|
— |
|
|
— |
|
|
(183 |
) |
|
|
|
|
|
|
|
|
|
|
|
|
Net cash provided by financing activities |
|
|
50,362 |
|
|
1,647 |
|
|
5,968 |
|
|
|
|
|
|
|
|
|
|
|
|
|
Effect of exchange rate changes on cash and cash equivalents |
|
|
(30 |
) |
|
(41 |
) |
|
(30 |
) |
Net increase (decrease) in cash |
|
|
28,270 |
|
|
(18,924 |
) |
|
(5,608 |
) |
Cash and cash equivalents at beginning of period |
|
|
20,682 |
|
|
48,952 |
|
|
30,028 |
|
|
|
|
|
|
|
|
|
|
|
|
|
Cash and cash equivalents at end of period |
|
$ |
48,952 |
|
$ |
30,028 |
|
$ |
24,420 |
|
|
|
|
|
|
|
|
|
|
|
|
|
|
|
|
|
|
|
|
|
|
|
|
|
|
|
|
|
|
|
|
|
|
|
|
|
Supplemental disclosures of non-cash investing and financing activities: |
|
|
|
|
|
|
|
|
|
|
Purchase of capital expenditures in accounts payable, accrued expenses and other current liabilities |
|
$ |
110 |
|
$ |
664 |
|
$ |
112 |
|
Common stock issued for the acquisition of Inner Balloons |
|
$ |
730 |
|
$ |
81 |
|
$ |
— |
|
Held back cash on other acquisition |
|
$ |
150 |
|
$ |
— |
|
$ |
— |
|
Deferred offering costs in accounts payable, accrued expenses and other current liabilities |
|
$ |
— |
|
$ |
— |
|
$ |
2,349 |
|
Cash paid on interest |
|
$ |
— |
|
$ |
— |
|
$ |
3 |
|
Cash paid on income taxes |
|
$ |
— |
|
$ |
— |
|
$ |
19 |
|
- (1)
- Proceeds
from the issuance of Series F preferred stock, net of issuance costs, related to existing stockholders was $25.0 million.
The accompanying notes are an integral part of these consolidated financial statements.
F-6
Table of Contents
YEXT, INC.
NOTES TO CONSOLIDATED FINANCIAL STATEMENTS
1. Organization and Description of Business
Description of Business
Yext, Inc. (the "Company") provides a knowledge engine platform that lets businesses manage their digital knowledge in the cloud and sync
it to over 100 services including Apple Maps, Bing, Cortana, Facebook, Google, Google Maps, Instagram, Siri and Yelp. The Company has built direct data integrations between its software and the
members of its PowerListings Network that end consumers around the globe use to discover new businesses, read reviews, and find accurate answers to their queries. The Company's cloud-based software
platform, the Yext Knowledge Engine, powers all of the Company's key features, including the Company's Listings, Pages and Reviews features along with its other features and capabilities.
Fiscal Year
The Company's fiscal year ends on January 31. References to fiscal 2017, for example, are to the fiscal year ended January 31,
2017.
2. Summary of Significant Accounting Policies
Basis of Presentation and Consolidation
The accompanying consolidated financial statements have been prepared in accordance with accounting principles generally accepted in the United
States of America ("GAAP"). The consolidated financial statements include the accounts of the Company and its wholly-owned subsidiaries. All significant intercompany balances and transactions have
been eliminated in consolidation.
Use of Estimates
The preparation of consolidated financial statements in conformity with GAAP requires management to make estimates and assumptions that affect
the reported amounts of assets and liabilities and disclosure of contingent assets and liabilities as of the date of the consolidated financial statements and the reported amounts of revenue and
expenses during the reporting period. Management bases its estimates on historical experience and on various other market-specific and relevant assumptions that management believes to be reasonable
under the circumstances. Actual results could differ from those estimates and such differences could be material to the financial position and results of operations.
Unaudited Pro Forma Balance Sheet Information
The unaudited pro forma balance sheet information as of January 31, 2017 presents the Company's stockholders' deficit as though all of
the Company's convertible preferred stock outstanding had automatically converted into an aggregate of 43,594,753 shares of the Company's common stock; and as though all of the Company's outstanding
warrants exercisable for shares of convertible preferred stock had automatically converted into warrants exercisable for 110,937 shares of common stock, upon the completion of a qualifying initial
public offering ("IPO") of the Company's common stock. The shares of common stock issuable and the proceeds expected to be received by the Company upon the completion of a qualifying IPO are excluded
from such pro forma financial information.
F-7
Table of Contents
YEXT, INC.
NOTES TO CONSOLIDATED FINANCIAL STATEMENTS (Continued)
2. Summary of Significant Accounting Policies (Continued)
Segment Information
The Company operates as one operating segment providing digital knowledge management services. Operating segments are defined as components of
an enterprise for which separate financial information is evaluated regularly by the chief operating decision maker ("CODM"). The Company defines its CODM as its executive officers. The role of the
CODM is to make decisions about allocating resources and assessing performance. The Company's business operates in one operating segment as all of the Company's offerings operate on a single platform
and are deployed in an identical way, with the CODM evaluating the Company's financial information, resources and performance of these resources on a consolidated basis. Since the Company operates in
one operating segment, all required financial segment information can be found in the consolidated financial statements.
Revenue Recognition
The Company derives its revenues primarily from subscription services. The Company sells subscriptions to its platform through contracts that
are typically one year in length, but may be up to three years or longer in length. The subscription contracts do not provide customers with the right to take possession of the software supporting the
applications and, as a result, are accounted for as service contracts.
The
Company sells its products through its direct sales force to its customers, including third-party resellers. The Company recognizes revenue when four basic criteria are met:
(1) persuasive evidence exists of an arrangement with the customer reflecting the terms and conditions under which the services will be provided; (2) services have been provided or
delivery has occurred; (3) the fee is fixed or determinable; and (4) collection is reasonably assured. Collectability is assessed based on a number of factors, including the
creditworthiness of a customer and transaction history.
The
Company recognizes revenue based on the amount billed to its customers, including third-party resellers. The Company's revenue consists solely of contractual fees for subscription
and support
services charged to its customers on a per-location basis. In transactions with resellers, the Company contracts only with the reseller, in which pricing, length of subscription and support services
are agreed upon. The reseller negotiates the price charged and length of subscription and support service directly with its customer. The Company does not pay separate fees to third-party resellers
and does not have direct interactions with the reseller's customer.
Subscription Revenue. Subscription revenue recognition commences on the date that the Company's
platform is made available to the customer, which is
the subscription start date, provided all of the other criteria described above are met. Revenue is recognized based on the terms of the customer contracts, which include a fixed fee based upon the
actual or contractual number of locations, and is recognized on a straight-line basis over the contractual term of the arrangement.
Multiple Deliverable Arrangements. Certain of the Company's arrangements include both a
subscription to the Company's platform and support services.
The Company evaluates each element in an arrangement to determine whether it represents a separate unit of accounting. An element constitutes a separate unit of accounting when the delivered item has
standalone value and delivery of the undelivered element is probable and within the Company's control. The Company's support services are not sold separately from the subscription and there is no
alternative use for them. Further, no other vendor provides similar support
F-8
Table of Contents
YEXT, INC.
NOTES TO CONSOLIDATED FINANCIAL STATEMENTS (Continued)
2. Summary of Significant Accounting Policies (Continued)
services.
Based on these factors, the support services do not have standalone value. Accordingly, subscription and support revenue is combined and recognized as a single unit of accounting.
The
Company recognizes the fixed portion of subscription fees and support services fees ratably over the contract term. Recognition begins when the customer has access to the Company's
platform and the support services have commenced.
Deferred Revenue
Deferred revenue primarily consists of billings or payments received in advance of revenue recognition from subscription services described
above and is reduced as the revenue recognition criteria are met. The deferred revenue balance is influenced by several factors, including seasonality, the compounding effects of renewals, invoice
duration, invoice timing and size.
Deferred
revenue that will be recognized during the succeeding twelve-month period is recorded as current deferred revenue within current liabilities. Typically, invoices are issued for
a period of 12 months or less. In those instances when invoicing is for a period greater than 12 months, the portion of the invoice that is for the period past 12 months is recorded as
long-term deferred revenue within other long-term liabilities in the Company's consolidated balance sheets.
Cost of Revenues
Cost of revenues consists of fees the Company paid for PowerListings Network application integrations, as well as expenses related to hosting
the Company's service and providing support services. These expenses are primarily comprised of personnel and related costs directly associated with the Company's cloud infrastructure and customer
support, including salaries, benefits, stock-based compensation, data center capacity costs and other allocated overhead costs, which the Company defines as rent, facilities and costs related to
information technology. Included in cost of revenues is depreciation and amortization of $0.4 million, $0.7 million and $1.1 million for the fiscal years ended January 31,
2015, 2016 and 2017, respectively.
Deferred Commissions
The Company capitalizes commissions costs that are incremental and directly related to selling subscription contracts to customers and consist
of sales commissions paid to the Company's direct sales force. The Company's subscription contracts are predominantly non-cancelable in nature. Commissions are earned by sales personnel upon the
execution of the sales contracts, and commission payments are made shortly after they are earned.
Commission
costs that are direct and incremental to selling revenue-generating customer contracts are deferred and amortized to sales and marketing expense over the terms of the related
subscription contracts, which are typically one year in length but may be up to three years or longer in length. The deferred commission amounts are recoverable through the future revenue streams
under the customer contracts.
The
Company capitalized commission costs of $3.8 million and $10.3 million during the fiscal years ended January 31, 2016 and 2017, respectively. Capitalized
commission costs are included in deferred commissions and other long term assets on the Company's consolidated balance sheets.
F-9
Table of Contents
YEXT, INC.
NOTES TO CONSOLIDATED FINANCIAL STATEMENTS (Continued)
2. Summary of Significant Accounting Policies (Continued)
Amortization
of deferred commissions of $1.6 million, $2.3 million and $4.7 million was included in sales and marketing expense in the accompanying consolidated
statements of operations and comprehensive loss for the fiscal years ended January 31, 2015, 2016 and 2017, respectively.
Deferred Offering Costs
Deferred offering costs, which consist primarily of direct incremental legal and accounting fees relating to the IPO, are capitalized. The
deferred offering costs will be offset against IPO proceeds upon the consummation of the offering. In the event the offering is terminated, the deferred offering costs will be expensed. As of
January 31, 2017, the Company has deferred $2.5 million of offering costs which are included in other long term assets on the consolidated balance sheets. No amounts were deferred as of
January 31, 2016.
Stock-Based Compensation
Compensation cost for all stock-based awards, including options to purchase stock and restricted stock units ("RSUs"), is measured at fair value
on the date of grant and recognized over the service period. The fair value of stock options is estimated on the date of grant using a
Black-Scholes model. The fair value of restricted stock units is estimated on the date of grant based on the fair value of the Company's common stock. Compensation cost is recognized over the
requisite service periods of awards, which is typically four years for options and one to three years for RSUs. The estimated forfeiture rate applied is based on historical forfeiture rates. The
estimated number of stock awards that will ultimately vest requires judgment, and to the extent actual results, or updated estimates, differ from the Company's current estimates, such amounts will be
recorded as a cumulative adjustment in the period estimates are revised.
Common Stock Valuations
The Company has historically granted stock options at exercise prices equal to the fair value as determined by the Company's Board of Directors
on the date of grant. In the absence of a public trading market, the Board of Directors, with input from management, exercised significant judgment and considered numerous objective and subjective
factors to determine the fair value of the Company's common stock as of the date of each stock option and RSU grant, including:
- •
- the Company's financial performance;
- •
- the rights, preferences and privileges of the convertible preferred stock relative to those of the common stock; and
- •
- general economic and financial conditions, and the trends specific to the markets in which the Company operates.
In
addition, the Board of Directors considered the independent valuations completed by a third-party valuation consultant. Valuations were generally performed as of a date immediately
preceding the regularly scheduled Board of Directors meeting. The valuations of the Company's common stock were determined in accordance with the guidelines outlined in the American Institute of Certified
Public Accountants Practice Aid, Valuation of Privately-Held-Company Equity Securities Issued as Compensation.
In performing these valuations, a variety of relevant factors were considered including, but not limited to:
- •
- the nature and history of the Company;
F-10
Table of Contents
YEXT, INC.
NOTES TO CONSOLIDATED FINANCIAL STATEMENTS (Continued)
2. Summary of Significant Accounting Policies (Continued)
- •
- the financial and economic conditions affecting the general economy, the Company and the industry;
- •
- the Company's past results, current operations and future prospects;
- •
- the Company's earnings capacity;
- •
- the economic benefit to the Company of both the tangible and intangible assets;
- •
- the market prices of actively traded interests in public entities engaged in the same or similar lines of business, as well as sales of
ownership interests in similar entities; and
- •
- the prices, terms and conditions of past sales of the Company's ownership interests.
In
valuing the common stock, the Company's enterprise value was estimated by utilizing the Probability-Weighted Expected Return Method ("PWERM") allocation method and the market
approach. The market-based approach considers multiples of financial metrics based on trading multiples of a selected peer group of companies in similar lines of business. For each of the possible
events, a range of future equity values is estimated, based on the market approach discussed above and over a range of possible liquidity event dates, all plus or minus a standard deviation for value
and timing. The timing of these events is based on the Company's expectations. In each valuation approach, the firm value is allocated across the capital structure using an option pricing model, which
recognizes the economic characteristics of each security and assigns value to each class based on those characteristics. A lack of marketability discount has been applied to the common stock in each
valuation in order to recognize the inherent illiquidity in holding stock of a privately held company.
Two
possible events were considered for estimating the Company's firm value. The first possible event, which assumes that the Company will complete an initial public offering ("IPO"),
utilizes a market-based approach. The second possible event, which assumes that the Company will remain a private company or experience a liquidation event other than an IPO, also utilizes the market
approach. In estimating the common stock value, a probability was assigned to each of the possible events based on an analysis of prevailing IPO market conditions, recent acquisitions and input from
management.
Once
the Company is operating as a public company, it will rely on the closing price of the Company's common stock as reported on the date of grant to determine the fair value of the
Company's common stock.
Advertising and Other Promotional Costs
Advertising and other promotional costs are expensed as incurred. Advertising expenses were $4.5 million, $5.1 million and
$4.7 million for the fiscal years ended January 31, 2015, 2016 and 2017, respectively.
Research and Development
Research and development costs are expensed as incurred. Research and development costs consist primarily of compensation costs for the
Company's development team which maintains and enhances the Company's platform, as well as planning, predevelopment and post-implementation costs associated with the development of enhancements to the
Company's software platform. Additionally, research and development costs also include certain integration costs associated with integrating the Company's various
F-11
Table of Contents
YEXT, INC.
NOTES TO CONSOLIDATED FINANCIAL STATEMENTS (Continued)
2. Summary of Significant Accounting Policies (Continued)
PowerListings
Network application providers within the Company's platform. Research and development costs were $11.9 million, $16.2 million and $19.3 million for the fiscal years
ended January 31, 2015, 2016 and 2017, respectively.
Capitalized Software Development Costs
The Company capitalizes certain development costs incurred in connection with software development for its cloud-based digital knowledge
management platform and certain projects for internal use during the application development stage. These software development costs are recorded as part of property and equipment.
Capitalized
software development costs are amortized on a straight-line basis to cost of revenues over the technology's estimated useful life, which is two to three years. The
unamortized software development costs included in Property and Equipment, net, as of January 31, 2016 and 2017, was $0.7 million and $1.2 million, respectively. Amortization
expense related to capitalized software was less than $0.1 million, $0.1 million and $0.4 million for the fiscal years ended January 31, 2015, 2016 and 2017, respectively.
Software
development costs incurred in the maintenance and minor upgrade and enhancement of software without adding additional functionality are expensed as incurred.
Other Income (Expense), Net
Other income (expense), net consists primarily of the change in the fair value of outstanding warrants to purchase the Company's convertible
preferred stock (see Note 2 "Convertible Preferred Stock Warrant Liability", interest expense associated with our Credit Agreement and related deferred financing costs, and interest
income earned on our cash and cash equivalents. For the fiscal year ended January 31, 2017, other income (expense), net includes $0.3 million expense for the change in the fair value of
the warrants, $0.1 million in interest expense, and less than $0.1 million of interest income.
Income Taxes
The Company accounts for income taxes in accordance with ASC Topic 740, "Income Taxes". Under this method, the recognition of deferred tax
assets and liabilities for the expected future tax consequences of events that have been included in the financial statements. Deferred tax assets and liabilities are determined on the basis of the
differences between the financial statement and tax bases of assets and liabilities using enacted tax rates in effect for the year in which the differences are expected to reverse. The Company
classifies all deferred income tax assets and liabilities as noncurrent on the Company's balance sheet. The effect of a change in tax rates on deferred tax assets and liabilities is recognized in
income in the period that includes the enactment date.
The
Company reduces deferred tax assets, if necessary, by a valuation allowance if it is more likely than not that the Company will not realize some or all of the deferred tax assets. In
making such a determination, the Company considers all available positive and negative evidence, including future reversals of existing taxable temporary differences, projected future taxable income,
tax-planning strategies, and results of recent operations.
The
Company recognizes the tax benefit from an uncertain tax position only if it is more likely than not that the tax position will be sustained on examination by taxing authorities,
based on the technical merits of the position. The Company recognizes interest and penalties related to uncertain tax positions in
F-12
Table of Contents
YEXT, INC.
NOTES TO CONSOLIDATED FINANCIAL STATEMENTS (Continued)
2. Summary of Significant Accounting Policies (Continued)
income
tax expense. Management evaluates the Company's uncertain tax positions, which are discussed within Note 10, "Income Taxes."
Convertible Preferred Stock Warrant Liability
The Company's freestanding warrants to purchase the Company's convertible preferred stock are classified as liabilities on the consolidated
balance sheets and recorded at fair value because these warrants may obligate the Company to transfer assets to the warrant holders at a future date under certain circumstances. The warrants are
subject to remeasurement to fair value at each balance sheet date, and any change in fair value is recognized in the consolidated statements of operations and comprehensive loss as other income
(expense), net. The Company will continue to adjust the liability for changes in fair value until the earlier of the exercise or expiration of the warrants. Upon an IPO, the outstanding warrants to
purchase the Company's convertible preferred stock will automatically convert into warrants to purchase the Company's common stock, and the related warrant liability will be reclassified to additional
paid-in capital.
Net Loss Per Share
Basic net loss per share is computed by dividing the net loss attributable to common stockholders by the weighted average number of common
shares outstanding during the period. Diluted net loss per share is computed by dividing the net loss attributable to common stockholders by the weighted average number of common shares plus common
equivalent shares for the period, including any dilutive effect from such shares. Common equivalent shares are convertible preferred stock, convertible preferred stock warrants, common stock warrants,
shares issuable upon the exercise of stock options and unvested shares of restricted stock units. Anti-dilutive common equivalent shares totaled 62,045,076 shares, 63,670,359 shares and 71,540,798
shares for the years ended January 31, 2015, 2016 and 2017, respectively. While these common equivalent shares are currently anti-dilutive, they could be dilutive in the future.
Foreign Currency
The functional currency of the Company's international subsidiaries is the local currency. The Company translates the financial statements of
these subsidiaries to U.S. dollars using month-end rates of exchange for assets and liabilities, and average rates for the annual period are derived from month-end spot rates for revenues, costs and
expenses. The Company records translation gains and losses in accumulated other comprehensive loss as a component of stockholders' deficit. Foreign currency transaction gains and losses are included
in net loss for the period.
Concentration of Credit Risk
The Company's financial instruments that are exposed to concentrations of credit risk consist primarily of cash and cash equivalents, restricted
cash and trade accounts receivable. Although the Company deposits its cash with multiple financial institutions, its deposits, at times, may exceed federally insured limits. Collateral is not required
for accounts receivable. The Company has not experienced any losses on its deposits of cash and cash equivalents to date. At January 31, 2016 and 2017, no single customer accounted for more
than 10% of accounts receivable.
F-13
Table of Contents
YEXT, INC.
NOTES TO CONSOLIDATED FINANCIAL STATEMENTS (Continued)
2. Summary of Significant Accounting Policies (Continued)
One
reseller customer accounted for approximately 12% and 10% of the Company's revenue for the fiscal years ended January 31, 2015 and 2016, respectively. No single customer
accounted for more than 10% of the Company's revenue for the fiscal year ended January 31, 2017.
Geographic Locations
Revenues by geographic region are as follows (in thousands):
|
|
|
|
|
|
|
|
|
|
|
|
|
Fiscal year ended January 31, |
|
|
|
2015 |
|
2016 |
|
2017 |
|
North America |
|
$ |
59,907 |
|
$ |
87,979 |
|
$ |
118,754 |
|
Europe |
|
|
95 |
|
|
1,745 |
|
|
5,507 |
|
|
|
|
|
|
|
|
|
|
|
|
|
Total |
|
$ |
60,002 |
|
$ |
89,724 |
|
$ |
124,261 |
|
|
|
|
|
|
|
|
|
|
|
|
|
|
|
|
|
|
|
|
|
|
|
|
|
|
|
|
|
|
|
|
|
|
|
|
|
North
American revenue is predominantly attributable to the United States but also includes revenue from Canada.
Fair Value of Financial Instruments
Fair value is the exchange price that would be received for an asset or paid to transfer a liability (an exit price) in the principal or most
advantageous market for the asset or liability in an orderly transaction between market participants on the measurement date. Subsequent changes in fair value of these financial assets and liabilities
are recognized in earnings or other comprehensive income when they occur. When determining the fair value measurements for assets and liabilities which are required to be recorded at fair value, the
Company considers the principal or most advantageous market in which the Company would transact and the market-based risk measurement or assumptions that market participants would use in pricing the
assets or liabilities, such as inherent risk, transfer restrictions, and credit risk.
The
Company applies the following fair value hierarchy, which prioritizes the inputs used to measure fair value into three levels and bases the categorization within the hierarchy upon
the lowest level of input that is available and significant to the fair value measurement:
- •
- Level 1 inputs are based on quoted prices in active markets for identical assets or liabilities.
- •
- Level 2 inputs are based on observable inputs other than Level 1 prices such as quoted prices for similar assets or liabilities;
quoted prices in markets with insufficient volume or infrequent transactions (less active markets); or model-derived valuations in which all significant inputs are observable or can be derived
principally from or corroborated by observable market data for substantially the full term of the assets or liabilities.
- •
- Level 3 inputs are based on unobservable inputs to the valuation methodology that are significant to the measurement of fair value of
assets or liabilities, and typically reflect management's estimates of assumptions that market participants would use in pricing the asset or liability.
The
Company considers all highly liquid investments purchased with a remaining maturity of three months or less to be cash equivalents. The fair value of the Company's investments in
certain money market funds is their face value. Such instruments are classified as Level 1 and are included in cash and cash equivalents on the consolidated balance sheets.
F-14
Table of Contents
YEXT, INC.
NOTES TO CONSOLIDATED FINANCIAL STATEMENTS (Continued)
2. Summary of Significant Accounting Policies (Continued)
The following summarizes assets and liabilities that are measured at fair value on a recurring basis, by level, within the fair value hierarchy (in thousands):
|
|
|
|
|
|
|
|
|
|
|
|
|
|
|
|
As of January 31, 2016 |
|
|
|
Level 1 |
|
Level 2 |
|
Level 3 |
|
Total |
|
Assets |
|
|
|
|
|
|
|
|
|
|
|
|
|
Cash equivalents—money market funds(1) |
|
$ |
17,519 |
|
$ |
— |
|
$ |
— |
|
$ |
17,519 |
|
|
|
|
|
|
|
|
|
|
|
|
|
|
|
|
|
|
$ |
17,519 |
|
$ |
— |
|
$ |
— |
|
$ |
17,519 |
|
|
|
|
|
|
|
|
|
|
|
|
|
|
|
|
|
|
|
|
|
|
|
|
|
|
|
|
|
|
|
|
|
|
|
|
|
|
|
|
|
|
|
|
|
|
Liabilities |
|
|
|
|
|
|
|
|
|
|
|
|
|
Preferred stock warrant liabilities(2) |
|
$ |
— |
|
$ |
— |
|
$ |
691 |
|
$ |
691 |
|
|
|
|
|
|
|
|
|
|
|
|
|
|
|
|
|
|
$ |
— |
|
$ |
— |
|
$ |
691 |
|
$ |
691 |
|
|
|
|
|
|
|
|
|
|
|
|
|
|
|
|
|
|
|
|
|
|
|
|
|
|
|
|
|
|
|
|
|
|
|
|
|
|
|
|
|
|
|
|
|
|
|
|
|
|
|
|
|
|
|
|
|
|
|
|
|
|
As of January 31, 2017 |
|
|
|
Level 1 |
|
Level 2 |
|
Level 3 |
|
Total |
|
Assets |
|
|
|
|
|
|
|
|
|
|
|
|
|
Cash equivalents—money market funds(1) |
|
$ |
9,785 |
|
$ |
— |
|
$ |
— |
|
$ |
9,785 |
|
|
|
|
|
|
|
|
|
|
|
|
|
|
|
|
|
|
$ |
9,785 |
|
$ |
— |
|
$ |
— |
|
$ |
9,785 |
|
|
|
|
|
|
|
|
|
|
|
|
|
|
|
|
|
|
|
|
|
|
|
|
|
|
|
|
|
|
|
|
|
|
|
|
|
|
|
|
|
|
|
|
|
|
Liabilities |
|
|
|
|
|
|
|
|
|
|
|
|
|
Preferred stock warrant liabilities(2) |
|
$ |
— |
|
$ |
— |
|
$ |
944 |
|
$ |
944 |
|
|
|
|
|
|
|
|
|
|
|
|
|
|
|
|
|
|
$ |
— |
|
$ |
— |
|
$ |
944 |
|
$ |
944 |
|
|
|
|
|
|
|
|
|
|
|
|
|
|
|
|
|
|
|
|
|
|
|
|
|
|
|
|
|
|
|
|
|
|
|
|
|
|
|
|
|
|
|
|
|
|
- (1)
- Included
in cash and cash equivalents.
- (2)
- Included
in accounts payable, accrued expenses and other current liabilities.
As
of January 31, 2016 and 2017, the Company had money market accounts of $17.5 million and $9.8 million, respectively. The money market accounts are presented at
fair market value based on quoted market prices and are classified within Level 1.
At
January 31, 2016 and 2017, the Company's valuation of outstanding warrants was measured using a Black-Scholes option pricing model and considered Level 3 inputs. See
Note 7, "Capital Stock" for further discussion of the Company's outstanding warrants and assumptions utilized.
The
following table represents the change in fair value of the convertible preferred stock warrant liability (in thousands):
|
|
|
|
|
Balance at January 31, 2015 |
|
$ |
304 |
|
Change in fair value |
|
|
387 |
|
|
|
|
|
|
|
Balance at January 31, 2016 |
|
|
691 |
|
Change in fair value |
|
|
253 |
|
|
|
|
|
|
|
Balance at January 31, 2017 |
|
$ |
944 |
|
|
|
|
|
|
|
|
|
|
|
|
|
|
|
|
|
|
|
F-15
Table of Contents
YEXT, INC.
NOTES TO CONSOLIDATED FINANCIAL STATEMENTS (Continued)
2. Summary of Significant Accounting Policies (Continued)
Cash and Cash Equivalents
The Company maintains cash with several high-credit quality financial institutions. The Company considers all cash investments available with
original maturities of three months or less
to be cash, and such investments consist of high-yield savings accounts. Cash equivalents include investments in money market funds, which are presented at fair value based on quoted market prices.
These
investments are not subject to significant market risk. For purposes of the statements of cash flows, cash includes all amounts in the balance sheet captioned "cash and cash
equivalents".
Restricted Cash
Restricted cash includes deposits in financial institutions used to secure lease agreements as well as to secure the Company's corporate credit
card program. At January 31, 2016, restricted cash was $6.3 million, of which $5.3 million related to funds held as security in favor of certain landlords for office space. On
March 16, 2016, the Company entered into a Loan and Security agreement with Silicon Valley Bank and allocated $5.3 million of the associated $7.0 million Letter of Credit as the
security in favor of certain landlords for office space, releasing the restrictions. As of January 31, 2017, restricted cash was $0.5 million, which is to secure the Company's credit
card program.
Accounts Receivable and Allowance for Doubtful Accounts
Accounts receivable are carried at the original invoiced amount less an allowance for doubtful accounts based on the probability of future
collection. The Company estimates the allowance for doubtful accounts based on historical loss patterns and the number of days that billings are past due. Accounts receivable are written off when
deemed uncollectible and collection of the receivable is no longer being actively pursued. The allowance for doubtful accounts was $0.5 million and $0.2 million as of January 31,
2016 and 2017, respectively.
|
|
|
|
|
|
|
|
|
|
|
|
|
|
Description
|
|
Balance at
beginning of year |
|
Additions |
|
Deductions
write offs |
|
Balance at end of year |
|
|
|
(in thousands)
|
|
Fiscal year ended January 31, 2017 |
|
|
|
|
|
|
|
|
|
|
|
|
|
Allowance for doubtful accounts |
|
$ |
516 |
|
$ |
653 |
|
$ |
(980 |
) |
$ |
189 |
|
Fiscal year ended January 31, 2016 |
|
|
|
|
|
|
|
|
|
|
|
|
|
Allowance for doubtful accounts |
|
|
99 |
|
|
582 |
|
|
(165 |
) |
|
516 |
|
Deferred Financing Costs
Financing costs incurred with securing a revolving line of credit are deferred and amortized to interest expense over the term of the agreement.
Financing costs associated with revolving credit arrangements are deferred, regardless of whether a balance is outstanding. The Company includes deferred financing costs in prepaid and other assets or
other long term assets on the consolidated balance sheet. The Company recognized $0.1 million of interest expense on the consolidated statement of operations and comprehensive loss for the
fiscal year ended January 31, 2017.
The Company had no outstanding debt and therefore no deferred financing costs during the fiscal year ended January 31, 2016.
F-16
Table of Contents
YEXT, INC.
NOTES TO CONSOLIDATED FINANCIAL STATEMENTS (Continued)
2. Summary of Significant Accounting Policies (Continued)
Property and Equipment, Net
Property and equipment are recorded at cost and depreciated on a straight-line basis over the estimated useful lives beginning in the year the
asset was placed into service. Furniture and fixtures are amortized over an estimated useful life of five years. Leasehold improvements and assets held under operating leases are amortized over the
shorter of the term of the lease or their useful life. Office and computer equipment and internal-use software are amortized over a useful life of two to three years. Upon retirement or sale of
assets, the cost and related accumulated depreciation and amortization are removed from the consolidated balance sheet and the resulting gain or loss is reflected in the consolidated statement of
operations and comprehensive loss. Maintenance and repair costs are expensed as incurred.
Business Combinations and Purchase Accounting
The results of a business acquired in a business combination are included in the Company's consolidated financial statements from the date of
acquisition. Purchase accounting results in assets and liabilities of an acquired business being recorded at their estimated fair values on the acquisition date. Any excess consideration over the fair
value of assets acquired and liabilities assumed is recognized as goodwill. Determining the fair value of assets acquired and liabilities assumed requires management to use significant judgment and
estimates including the selection of valuation methodologies, estimates of future revenue, costs and cash flows, discount rates and selection of comparable companies. The Company engages the
assistance of valuation specialists, where appropriate, in concluding on fair value measurements in connection with determining fair values of assets acquired and liabilities assumed in a business
combination. Transaction costs associated with business combinations are expensed as incurred.
Goodwill and Intangible Assets
Goodwill represents the excess of cost over the fair value of the net tangible and identifiable intangible assets acquired in a business
combination.
The
Company has no other intangible assets with indefinite useful lives. Goodwill is not amortized but is subject to periodic testing for impairment in accordance with ASC Topic 350,
"Intangibles-Goodwill and Other." The Company's goodwill is evaluated at the entity level as it is determined there is one reporting unit. The Company performs its annual impairment test on
November 1st of each year, or more frequently if events occur or circumstances change that would more likely than not reduce the fair value of a reporting unit below its carrying amount.
The Company considers the following potential indicators of impairment: significant underperformance relative to historical or projected future operating results, significant changes in the Company's
use of acquired assets or the strategy of the Company's overall business, significant negative industry or economic trends and a significant decline in the value of the Company's enterprise value for
a sustained period. No goodwill impairment was recorded for any of the periods presented.
The
Company's intangible assets with definite lives include customer relationships, website development, trade names and trademarks, acquired technology and domains. These intangible
assets are amortized on a straight-line basis over their estimated useful lives, which range from three to fifteen years. Long-lived assets, including intangible assets with finite lives, are reviewed
for impairment whenever events or changes in circumstances indicate that the carrying amount of such assets may not be recoverable in accordance with ASC Topic 360, "Property, Plant, and Equipment."
The Company assesses the impairment of long-lived intangible assets whenever events or changes in circumstances indicate that the
F-17
Table of Contents
YEXT, INC.
NOTES TO CONSOLIDATED FINANCIAL STATEMENTS (Continued)
2. Summary of Significant Accounting Policies (Continued)
carrying
amount may not be recoverable. The Company has not recorded impairment charges on intangible assets for the periods presented in these consolidated financial statements.
Legal and Other Contingencies
From time to time, the Company may be a party to litigation and subject to claims incident to the ordinary course of business, including
intellectual property claims, labor and employment claims, breach of contract claims and other asserted and unasserted claims. The Company investigates these claims as they arise and accrues estimates
for resolution of legal and other contingencies when losses are probable and estimable.
Recent Accounting Pronouncements
In May 2014, the Financial Accounting Standards Board ("FASB") issued Accounting Standards Update, "ASU", No. 2014-09, "Revenue from
Contracts with Customers (Topic 606)" ("ASU 2014-09"). ASU 2014-09 establishes principles for recognizing revenue upon the transfer of promised goods or services to customers, in an amount that
reflects the expected consideration received in exchange for those goods or services. ASU 2014-09 is effective for public entities for annual reporting periods, and interim periods within those annual
reporting periods, beginning after December 31, 2017. For all other entities, including emerging growth companies, the standard is effective for annual reporting periods beginning after
December 15, 2018, and interim periods within annual reporting periods, beginning after December 15, 2019. Early adoption of this standard is permitted for all entities. The guidance
allows for the amendment to be applied either retrospectively to each prior reporting period presented or retrospectively as a cumulative-effect adjustment as of the date of adoption. The Company
plans to adopt the standard under a modified retrospective transition method and is currently evaluating the impact of adopting ASU 2014-09 on its consolidated financial statements.
In
August 2014, the FASB issued ASU No. 2014-15, "Disclosures of Uncertainties About an Entity's Ability to Continue as a Going Concern." This standard provides guidance on
how and when reporting entities must disclose going-concern uncertainties in their financial statements. The Company adopted this standard in the fiscal year ended January 31, 2017. There was
no impact from the application of the new guidance.
In
February 2016, the FASB issued ASU No. 2016-02, "Leases," which will require lessees to recognize a right-of-use asset and a lease liability, initially measured at the present
value of the lease payments, on its balance sheet for operating leases. The standard also requires a lessee to recognize a single lease cost, calculated so that the cost of the lease is allocated over
the lease term, on a generally straight-line basis. The standard is effective for public entities for annual reporting periods, and interim periods within those annual reporting periods, beginning
after December 15, 2018. For all other entities, including emerging growth companies, the standard is effective for annual reporting periods beginning
after December 15, 2019, and interim periods within annual reporting periods beginning after December 15, 2020. The Company is evaluating the potential impact of adopting this new
accounting guidance.
In
March 2016, the FASB issued ASU No. 2016-09, "Stock Compensation: Improvements to Employee Shared-Based Payment Accounting," which simplifies and improves several aspects of
the accounting for employee share-based payment transactions for public entities. The guidance will require all tax effects related to share-based payments at settlement or expiration to be recorded
through the income
F-18
Table of Contents
YEXT, INC.
NOTES TO CONSOLIDATED FINANCIAL STATEMENTS (Continued)
2. Summary of Significant Accounting Policies (Continued)
statement
and be reported as operating activities on the statement of cash flows. Further, under the new guidance, entities are permitted to make an accounting policy election for the impact of
forfeitures on the recognition of expense for share-based payment awards, whereby forfeitures can be estimated, as required today, or recognized when they occur. The standard is effective for public
entities for annual reporting periods, and interim periods within those annual periods, beginning after December 15, 2016. For all other entities, including emerging growth companies, the
standard is effective for annual periods beginning after December 15, 2017, and interim periods within annual periods beginning after December 15, 2018. Early adoption is permitted for
any entity in any interim or annual period. The Company is evaluating the potential impact of adopting this new accounting guidance.
In
January 2017, the FASB issued ASU No. 2017-04, "Intangibles—Goodwill and Other: Simplifying the Test for Goodwill Impairment," to simplify the subsequent
measurement of goodwill by eliminating Step 2 from the goodwill impairment test. The standard is effective for public entities for annual or any interim goodwill impairment tests in annual reporting
years beginning after December 15, 2019. For all other entities, including emerging growth companies, the standard is effective for annual or any interim goodwill impairment tests in annual
reporting years beginning after December 15, 2021. Early adoption of this standard is permitted. The Company does not expect the adoption of this ASU to have a material impact on its
consolidated financial statements.
3. Acquisitions
During the fiscal year ended January 31, 2015, the Company completed the following acquisitions:
In December 2014, the Company acquired 100% of the outstanding capital stock of Inner Balloons Consulting B.V. to facilitate the
Company's international expansion. The purchase agreement was designated in euros and resulted in an aggregate purchase price of $7.9 million, consisting of $5.1 million in cash and
810,800 shares of the Company's common stock. The common stock had a fair value of $3.456 per share, or $2.8 million. There was no contingent consideration.
Of
the 810,800 shares of purchase consideration, 729,720 shares were issued at the acquisition date, and 81,080 shares were held back and were not issued until December 15, 2015,
the one-year anniversary of the closing date of the acquisition. There was no employment or other contingent consideration associated with the issuance of the shares issued at the acquisition date or
the hold back date. The obligation to issue shares in the future was not considered contingent consideration because it was not contingent on a future event or condition being met, i.e., the
payment was based solely on the passage of time. Therefore, the shares held back were measured at fair value at the acquisition date and included in the consideration transferred. Further, as the held
back shares could only be gross physically settled in unregistered shares of the Company and there were no provisions that required cash settlement, the value of these shares was recorded in equity on
the acquisition date; however, as the held back shares were not issued on the acquisition date, they are presented as issued on the Company's statements of convertible preferred stock and
stockholders' deficit when issued in December 2015, the one-year anniversary of the acquisition date.
Goodwill
is not deductible for tax purposes and is attributable to expected synergies resulting from integrating operations, and marketing with the existing business.
F-19
Table of Contents
YEXT, INC.
NOTES TO CONSOLIDATED FINANCIAL STATEMENTS (Continued)
3. Acquisitions (Continued)
The
following table summarizes the recognized amounts of identifiable assets and liabilities assumed:
|
|
|
|
|
|
|
|
Estimated Fair
Value
(In thousands) |
|
Estimated Useful
Life
(In years) |
Cash and cash equivalents |
|
$ |
500 |
|
|
Current assets |
|
|
217 |
|
|
Noncurrent assets |
|
|
29 |
|
|
Current liabilities |
|
|
(474 |
) |
|
Deferred tax liabilities |
|
|
(1,368 |
) |
|
Intangible assets: |
|
|
|
|
|
Customer relationships |
|
|
5,256 |
|
7 |
Software technology |
|
|
102 |
|
5 |
Trademarks |
|
|
112 |
|
5 |
Goodwill |
|
|
3,492 |
|
Indefinite |
|
|
|
|
|
|
|
Total identifiable net assets |
|
$ |
7,866 |
|
|
|
|
|
|
|
|
|
|
|
|
|
|
|
|
|
|
|
|
|
|
|
For
fiscal 2015, revenues and net loss included in the Company's consolidated statement of operations and comprehensive loss from the date of acquisition were $0.1 million and
$0.2 million, respectively.
During the fiscal year ended January 31, 2015, the Company completed another acquisition which resulted in $1.5 million in
goodwill. Goodwill is deductible for tax purposes and is attributable to expected synergies resulting from integrating operations, and marketing with the existing business. The Company's consolidated
financial statements include the operating results of the acquired entity since its acquisition date. The revenues and expenses specific to this business are not material to the Company's consolidated
financial statements.
For
the fiscal years ended January 31, 2016 and 2017, the Company did not complete any acquisitions.
F-20
Table of Contents
YEXT, INC.
NOTES TO CONSOLIDATED FINANCIAL STATEMENTS (Continued)
4. Goodwill and Other Intangible Assets
The following table summarizes the changes in goodwill (in thousands):
|
|
|
|
|
Balance as of January 31, 2015 |
|
$ |
4,614 |
|
Foreign currency translation |
|
|
(135 |
) |
|
|
|
|
|
|
Balance as of January 31, 2016 |
|
|
4,479 |
|
Foreign currency translation |
|
|
(35 |
) |
|
|
|
|
|
|
Balance as of January 31, 2017 |
|
$ |
4,444 |
|
|
|
|
|
|
|
|
|
|
|
|
|
|
|
|
|
|
|
The
Company, which has one reporting unit, performs its annual test for goodwill impairment on November 1 of each year. For the fiscal years ended January 31, 2016 and
2017, the Company performed its annual test for goodwill impairment and determined that goodwill was not impaired. In addition, there have been no significant events or circumstances affecting the
valuation of goodwill subsequent to the Company's annual assessment.
The following table summarizes the other intangible asset balances (dollars in thousands):
|
|
|
|
|
|
|
|
|
|
|
|
|
|
|
|
|
|
|
Gross
Carrying
Value |
|
Accumulated
Amortization |
|
Foreign
Exchange |
|
Net
Book Value |
|
Weighted
Average
Remaining
Useful Life
(years) |
|
Website development |
|
$ |
904 |
|
$ |
(680 |
) |
$ |
— |
|
$ |
224 |
|
|
1.6 |
|
Domains |
|
|
67 |
|
|
(7 |
) |
|
— |
|
|
60 |
|
|
13.5 |
|
Customer relationships |
|
|
5,256 |
|
|
(705 |
) |
|
(888 |
) |
|
3,663 |
|
|
5.9 |
|
Software technology |
|
|
102 |
|
|
(19 |
) |
|
(15 |
) |
|
68 |
|
|
3.9 |
|
Trade names and trademarks |
|
|
112 |
|
|
(21 |
) |
|
(16 |
) |
|
75 |
|
|
3.9 |
|
|
|
|
|
|
|
|
|
|
|
|
|
|
|
|
|
|
|
Total at January 31, 2016 |
|
|
6,441 |
|
|
(1,432 |
) |
|
(919 |
) |
|
4,090 |
|
|
5.7 |
|
|
|
|
|
|
|
|
|
|
|
|
|
|
|
|
|
|
|
Website development |
|
|
904 |
|
|
(826 |
) |
|
— |
|
|
78 |
|
|
0.8 |
|
Domains |
|
|
365 |
|
|
(26 |
) |
|
— |
|
|
339 |
|
|
14.0 |
|
Customer relationships |
|
|
5,256 |
|
|
(1,158 |
) |
|
(1,442 |
) |
|
2,656 |
|
|
4.9 |
|
Trade names and trademarks |
|
|
112 |
|
|
(40 |
) |
|
(17 |
) |
|
55 |
|
|
2.9 |
|
|
|
|
|
|
|
|
|
|
|
|
|
|
|
|
|
|
|
Total at January 31, 2017 |
|
$ |
6,637 |
|
$ |
(2,050 |
) |
$ |
(1,459 |
) |
$ |
3,128 |
|
|
5.7 |
|
|
|
|
|
|
|
|
|
|
|
|
|
|
|
|
|
|
|
|
|
|
|
|
|
|
|
|
|
|
|
|
|
|
|
|
|
|
|
|
|
|
|
|
|
|
|
|
|
|
|
|
|
|
|
F-21
Table of Contents
YEXT, INC.
NOTES TO CONSOLIDATED FINANCIAL STATEMENTS (Continued)
4. Goodwill and Other Intangible Assets (Continued)
Amortization
expense related to intangible assets totaled $0.3 million, $0.8 million and $0.8 million for the fiscal years ended January 31, 2015, 2016 and
2017, respectively.
As
of January 31, 2017, the future amortization expense of other intangible assets was as follows (in thousands):
|
|
|
|
|
Fiscal year ending January 31:
|
|
|
|
2018 |
|
$ |
659 |
|
2019 |
|
|
587 |
|
2020 |
|
|
582 |
|
2021 |
|
|
564 |
|
2022 |
|
|
519 |
|
Thereafter |
|
|
217 |
|
|
|
|
|
|
|
Total |
|
$ |
3,128 |
|
|
|
|
|
|
|
|
|
|
|
|
|
|
|
|
|
|
|
No
events or changes in circumstances have occurred to suggest that the carrying amounts for any of the Company's long-lived assets or identifiable intangible assets may not be
recoverable.
5. Property and Equipment, net
Property and equipment, net consisted of the following (in thousands):
|
|
|
|
|
|
|
|
|
|
January 31, |
|
|
|
2016 |
|
2017 |
|
Furniture and fixtures |
|
$ |
501 |
|
$ |
625 |
|
Office equipment |
|
|
2,420 |
|
|
3,383 |
|
Leasehold improvements |
|
|
12,034 |
|
|
12,695 |
|
Computer software |
|
|
813 |
|
|
1,740 |
|
Construction in progress |
|
|
6 |
|
|
284 |
|
|
|
|
|
|
|
|
|
|
Total property and equipment |
|
|
15,774 |
|
|
18,727 |
|
Less: accumulated depreciation and amortization |
|
|
(3,816 |
) |
|
(7,114 |
) |
|
|
|
|
|
|
|
|
|
Total property and equipment, net |
|
$ |
11,958 |
|
$ |
11,613 |
|
|
|
|
|
|
|
|
|
|
|
|
|
|
|
|
|
|
|
|
|
|
|
|
|
|
|
|
Depreciation
expense was $0.9 million, $2.3 million and $3.3 million for the fiscal years ended January 31, 2015, 2016 and 2017, respectively.
F-22
Table of Contents
YEXT, INC.
NOTES TO CONSOLIDATED FINANCIAL STATEMENTS (Continued)
6. Accounts Payable, Accrued Expenses and Other Current Liabilities
Accounts payable, accrued expenses and other current liabilities consisted of the following (in thousands):
|
|
|
|
|
|
|
|
|
|
January 31, |
|
|
|
2016 |
|
2017 |
|
Accounts payable |
|
$ |
4,977 |
|
$ |
5,303 |
|
Accrued employee compensation |
|
|
5,274 |
|
|
10,607 |
|
Accrued offering costs |
|
|
— |
|
|
2,349 |
|
Accrued PowerListings Network application provider fees |
|
|
1,299 |
|
|
1,602 |
|
Accrued sales tax |
|
|
1,804 |
|
|
1,213 |
|
Preferred stock warrant liabilities |
|
|
691 |
|
|
944 |
|
Other |
|
|
3,502 |
|
|
3,615 |
|
|
|
|
|
|
|
|
|
|
Total |
|
$ |
17,547 |
|
$ |
25,633 |
|
|
|
|
|
|
|
|
|
|
|
|
|
|
|
|
|
|
|
|
|
|
|
|
|
|
|
|
7. Capital Stock
Convertible Preferred Stock
Issuance of Series F Convertible Preferred Stock
In May 2014, the Company issued 8,642,486 shares of Series F convertible preferred stock at an issuance price per share of $5.8143 for
$50.1 million aggregate net consideration, after issuance costs of $0.2 million. The Series F convertible preferred stock has rights, preferences and privileges similar to the
Series A through Series E classes of convertible preferred stock, as discussed below.
Overview
The Company has issued six series of convertible preferred stock, Series A through Series F ("convertible preferred stock"). The
following table summarizes the authorized, issued and outstanding convertible preferred stock of the Company as of January 31, 2016 and 2017 (in thousands, except share and per share data):
|
|
|
|
|
|
|
|
|
|
|
|
|
|
|
|
|
|
|
Class
|
|
Issue Date |
|
Issuance
Price per
share |
|
Shares
Authorized |
|
Shares
Issued and
Outstanding |
|
Net
Carrying
Value |
|
Liquidation
Preference |
|
Series A |
|
May 2008 |
|
$ |
0.3170 |
|
|
5,740,728 |
|
|
5,740,728 |
|
$ |
1,766 |
|
$ |
1,820 |
|
Series B |
|
September 2008 |
|
|
0.4440 |
|
|
4,662,163 |
|
|
4,662,163 |
|
|
2,032 |
|
|
2,070 |
|
Series C Round I |
|
October 2009 |
|
|
2.3058 |
|
|
10,905,170 |
|
|
10,905,170 |
|
|
24,803 |
|
|
25,145 |
|
Series C Round II |
|
October 2010 |
|
|
2.3058 |
|
|
2,168,446 |
|
|
2,168,446 |
|
|
4,992 |
|
|
5,000 |
|
Series D |
|
July 2011 |
|
|
2.4220 |
|
|
4,128,818 |
|
|
4,128,818 |
|
|
9,966 |
|
|
10,000 |
|
Series E |
|
June 2012 |
|
|
3.6784 |
|
|
7,346,942 |
|
|
7,346,942 |
|
|
26,973 |
|
|
27,025 |
|
Series F |
|
May 2014 |
|
|
5.8143 |
|
|
8,642,486 |
|
|
8,642,486 |
|
|
50,083 |
|
|
50,250 |
|
|
|
|
|
|
|
|
|
|
|
|
|
|
|
|
|
|
|
|
|
|
|
|
|
|
|
|
|
43,594,753 |
|
|
43,594,753 |
|
$ |
120,615 |
|
$ |
121,310 |
|
|
|
|
|
|
|
|
|
|
|
|
|
|
|
|
|
|
|
|
|
|
|
|
|
|
|
|
|
|
|
|
|
|
|
|
|
|
|
|
|
|
|
|
|
|
|
|
|
|
|
|
|
|
|
|
|
|
|
|
|
F-23
Table of Contents
YEXT, INC.
NOTES TO CONSOLIDATED FINANCIAL STATEMENTS (Continued)
7. Capital Stock (Continued)
The significant rights, preferences, and privileges of convertible preferred stock are as follows:
Conversion Rights: Each share of the convertible preferred stock is convertible, at the option of the
holder, into fully paid shares of common stock, as is determined by dividing the original purchase price of convertible preferred stock by the conversion price in effect at the time of conversion for
such series of convertible preferred stock, subject to adjustments for stock dividends, splits, combinations and similar events. As of January 31, 2016 and 2017, each share of convertible
preferred stock is convertible into common stock on a one-to-one basis.
Each
share of convertible preferred stock will automatically be converted into common stock at the then-applicable conversion rate: (i) in the event of the closing of a best
efforts or firm commitment underwritten public offering with gross proceeds to the Company of not less than $50,000,000; or (ii) upon the written consent of (a) holders of at least a
majority of the then-outstanding shares of Preferred Stock, voting together as a single class on an as-converted basis and (b) the holders of at least a majority of the then outstanding shares
of Series F Preferred Stock, voting together as a separate class.
Redemption: The convertible preferred stock is not mandatorily redeemable in connection with the
offering. However, a merger or sale of substantially
all of the Company's assets would constitute a redemption event.
Voting: Each share of convertible preferred stock has voting rights equal to an equivalent number of
shares of common stock into which it is
convertible and votes together as one class with the common stock, except as follows: (i) the holders of a majority of Series A, B and D are entitled to elect one member of the Company's
Board of Directors; (ii) the holders of a majority of the Series C convertible preferred stock, voting exclusively and as a separate class, are entitled to elect one director;
(iii) holders of the common stock, voting exclusively and as a separate class, are entitled to elect three directors; and (iv) holders of the common stock and the preferred stock, voting
together as a single class, are entitled to elect four members to the Company's Board of Directors, including one individual who is mutually acceptable to the active founders of the Company and three
individuals who have been designated by the Company's Board of Directors as being mutually and reasonably acceptable to each of the other members of the Company's Board of Directors and are not
otherwise affiliates of the Company or any stockholder of the Company.
Dividends: The convertible preferred stock has similar dividend rights as common stock. Any dividend or
distribution would be distributed to all
holders of convertible preferred stock or common stock in proportion to the number of shares of common stock that would be held by each holder as if all convertible preferred stock were converted at
the conversion ratio in effect at the time of the dividend in preference and priority to the holders of convertible preferred stock, if and when declared by the board of directors. No dividends have
been declared for any of the periods presented.
Liquidation Preference: The convertible preferred stock is non-participating. In the event of any
liquidation, dissolution or winding up of the
Company, each share of convertible preferred stock shall be entitled to be paid out of the assets of the Company available for distribution to its stockholders, before any payment shall be made to the
holders of common stock by reason of their ownership thereof, an amount per share equal to the greater of: (i) the original issue price plus accrued but unpaid dividends if any, on each such
share; or (ii) the amount to which such share of convertible preferred stock would be entitled to on an as-converted basis.
F-24
Table of Contents
YEXT, INC.
NOTES TO CONSOLIDATED FINANCIAL STATEMENTS (Continued)
7. Capital Stock (Continued)
The
Company classifies the convertible preferred stock as temporary equity in the mezzanine section on the consolidated balance sheet, in accordance with ASC Topic 480-10-S99-3A, since
the shares possess liquidation features which may trigger a distribution of cash or assets that is not solely within the Company's control. Upon the occurrence of certain deemed liquidation events,
convertible preferred stockholders can require the Company to redeem their shares of convertible preferred stock.
The
convertible preferred stock was initially measured at its fair value at the issuance date and the carrying amount of convertible preferred stock is not remeasured as long as it is
not probable of becoming redeemable. Costs directly associated with the issuance of the convertible preferred stock, such as legal costs, were recorded at issuance as a reduction to the convertible
preferred stock amount. At the time when a deemed liquidation event is considered probable, the convertible preferred stock will be remeasured to its redemption value (i.e., liquidation
preference), and the Company then will adjust the carrying amount of the instrument to equal the redemption value at the end of each reporting period. As of January 31, 2016 and 2017, the
Company concluded that a deemed liquidation event was not probable and therefore convertible preferred stock is presented net of issuance costs.
Common Stock
Overview
As of January 31, 2016 and 2017, the Company had authorized 100,294,750 and 200,000,000 shares, respectively, of voting
$0.001 par value common stock. Each holder of the Company's common stock is entitled to one vote for each share on all matters to be voted upon by the stockholders and there are no cumulative rights.
Subject to any preferential rights of any outstanding preferred stock, holders of the Company's common stock are entitled to receive ratably the dividends, if any, as may be declared from time to time
by the Board of Directors out of legally available funds. If there is a liquidation, dissolution or winding up of the Company, holders of the Company's common stock would be entitled to share in the
Company's assets remaining after the payment of liabilities and any preferential rights of any outstanding preferred stock.
Holders
of the Company's common stock have no preemptive or conversion rights or other subscription rights, and there are no redemption or sinking fund provisions applicable to the
common stock. All outstanding shares of the Company's common stock will be fully paid and non-assessable. The rights, preferences and privileges of the holders of the Company's common stock are
subject to, and may be adversely affected by, the rights of the holders of shares of any series of preferred stock which the Company may designate and issue in the future.
Tender Offer
On July 16, 2015, the Company commenced a tender offer pursuant to which the Company offered to purchase securities from certain holders
of its capital stock and options to purchase common stock at a price equal to $5.00 per share. Eligible participants included current employees who owned common stock as of July 17, 2015 and
current and former employees who owned vested stock options as of July 31, 2015. Eligible holders had the opportunity to either sell common stock to the Company for $5.00 per share or cancel
vested common stock options in exchange for cash equal to $5.00 per share less the per share exercise price.
F-25
Table of Contents
YEXT, INC.
NOTES TO CONSOLIDATED FINANCIAL STATEMENTS (Continued)
7. Capital Stock (Continued)
On
August 17, 2015, the Company completed the tender offer. A total of 4.7 million shares of outstanding common stock were repurchased by the Company and 1.2 million
stock options were tendered, for total cash consideration of $28.3 million. All common stock repurchased was retired and
all stock options were cancelled. Of the consideration paid in the tender offer the value associated with common stock was recorded through accumulated deficit and the value associated with the stock
options was recorded through paid-in-capital.
On
July 16, 2015, in contemplation of the tender offer, the Company entered into a Common Stock Purchase agreement with certain of its investors, all of whom were considered
related parties of the Company, for the purchase of newly issued common stock equal to the aggregate number of shares repurchased by the Company and shares underlying cancelled options in the tender
offer. The newly issued shares were to be sold at a price per share of $5.00, which represented the fair value of the common stock on that date. Concurrent with the close of the tender offer on
August 17, 2015, the Company sold 5.9 million shares of common stock at $5.00 per share, for total proceeds of $29.5 million.
Treasury Stock
The Company has 6,505,334 shares of treasury stock which are carried at its cost basis of $11.9 million on the Company's consolidated
balance sheets. The treasury stock is the result of share repurchases in October 2009.
Convertible Preferred Stock Warrants
In 2009, in conjunction with a revolving line of credit agreement with a financial institution, the Company issued warrants to purchase 67,568
shares of Series B Preferred Stock for $0.444 per share (the "Series B warrants"). As of January 31, 2016 and 2017, the Series B warrants were still outstanding and are
presented on the balance sheets as a liability at their fair value.
In
2011, in conjunction with a line of credit agreement, the Company issued additional warrants to purchase 43,369 shares of Series C Preferred Stock for $2.3058 per share (the
"Series C warrants" and together with the Series B warrants, the "convertible preferred stock warrants"). As of January 31, 2016 and 2017, the Series C warrants were still
outstanding and are presented on the balance sheets as a liability at their fair value.
The
fair values of the convertible preferred stock warrants were estimated using a Black-Scholes model. The estimated value includes assumptions related to the fair value of the
underlying convertible preferred stock price per share, the exercise price, expected volatility, expected term, risk-free interest
rate, and the expected dividend yield. Expected volatility is based on historical volatility of a group of comparable companies. The estimated expected term represents the remaining contractual term
of the warrants. Dividend yields are based upon historical dividend yields. The risk-free interest rate is based on the U.S. Treasury yield for a term consistent with the estimated expected term. The
convertible preferred stock warrants are classified as Level 3 financial instruments.
F-26
Table of Contents
YEXT, INC.
NOTES TO CONSOLIDATED FINANCIAL STATEMENTS (Continued)
7. Capital Stock (Continued)
The
following assumptions were used in estimating the fair value of the warrants using the Black-Scholes model:
|
|
|
|
|
|
|
|
|
Fiscal year ended January 31, |
|
|
2015 |
|
2016 |
|
2017 |
Expected term (years) |
|
4.00 to 6.29 |
|
3.00 to 5.29 |
|
2.00 to 4.29 |
Expected volatility |
|
55.38% |
|
50.32% |
|
42.01% to 48.27% |
Dividend yield |
|
0.00% |
|
0.00% |
|
0.00% |
Risk-free rate |
|
0.87% to 2.00% |
|
0.92% |
|
1.19% to 1.73% |
The
Company recorded a liability representing the fair value of the convertible preferred stock warrants of $0.7 million and $0.9 million as of January 31, 2016 and
2017, respectively, within accounts payable, accrued expenses and other liabilities on the accompanying balance sheets. The Company classifies the convertible preferred stock warrants as liabilities
on the consolidated balance sheets, in accordance with ASC Topic 480, as the underlying convertible preferred stock instruments possess liquidation features which may trigger a distribution of
cash or assets that is not solely within the Company's control. For the fiscal years ended January 31, 2015, 2016 and 2017, the Company recognized income of $0.1 million, and expense of
$0.4 million and $0.3 million, respectively, to adjust the convertible preferred stock warrants to fair value. These amounts have been recorded within Other income (expense), net in the
accompanying consolidated statements of operations and comprehensive loss.
Common Stock Warrants
In 2012, the Company issued 50,000 warrants to purchase common stock at a strike price of $2.27 per share. These warrants have a 5-year life and
are included in permanent equity on the balance sheets. In 2012, the Company issued 35,000 warrants to purchase common stock at a strike price of $2.27 per share. These warrants have a 10-year life
and are included in permanent equity at their grant-date fair value, as determined using the Black-Scholes model. As of January 31, 2016 and 2017, these warrants were still outstanding.
8. Stock-Based Compensation
2008 Equity Incentive Plan
The Company's 2008 Equity Incentive Plan (the "2008 Plan"), as amended on March 10, 2016, allowed for the issuance of up to 25,912,531
shares of common stock. Awards granted under the 2008 Plan may be incentive stock options ("ISOs"), nonqualified stock options ("NQSOs"), restricted stock or restricted stock units ("RSUs"). The 2008
Plan is administered by the Board of Directors, which determines the terms of the options granted, the exercise price, the number of shares subject to option and the option vesting period. No ISO or
NQSO is exercisable after 10 years from the date of grant, and option awards will typically vest over a four-year period.
The
2008 Plan was terminated in connection with the adoption of the Company's 2016 Equity Incentive Plan (the "2016 Plan") in December 2016, and the Company will not grant any additional
awards under the 2008 Plan. However, the 2008 Plan will continue to govern the terms and conditions of the outstanding awards previously granted thereunder.
F-27
Table of Contents
YEXT, INC.
NOTES TO CONSOLIDATED FINANCIAL STATEMENTS (Continued)
8. Stock-Based Compensation (Continued)
2016 Equity Incentive Plan
In December 2016, the Company's Board of Directors adopted, and its stockholders approved, the 2016 Plan, which became effective upon adoption
and allows for the issuance of up to 10,000,000 shares of common stock. Following the effectiveness of the 2016 Plan, no further shares may be issued under the 2008 Plan. In addition, the shares
reserved for issuance under the 2016 Plan also include shares returned to the 2008 Plan as the result of expiration or termination of options or other awards. The maximum number of shares that may be
added to the 2016 Plan pursuant to the foregoing from the 2008 Plan is 24,400,000 shares.
Determination of Fair Value
The Company estimated the fair value of each ISO and NQSO option award on the date of grant using the Black-Scholes option pricing model. The
Company's assumptions about stock price volatility were based on the average of the historical volatility for a sample of comparable companies with a look back period equal to the expected term of
options granted to the Company's employees. Due to the limitations on the sale of the Company's common stock, there have not been a significant number of options exercised to date, thus the Company
estimated the expected term based upon the simplified method, which is the mid-point between the vesting date and the end of the contractual term for each option. The risk-free interest rate for
periods within the contractual life of the award was based on the U.S. Treasury yield curve in effect at the time of grant. The Company's Board of Directors utilizes independent valuations and other
available information when estimating the value of the stock underlying the granted options. The weighted-average estimated fair value of options granted during the fiscal years ended
January 31, 2015, 2016 and 2017 was $1.74, $2.87 and $3.57, respectively.
The
fair values of stock options granted during the fiscal years ended January 31, 2015, 2016 and 2017 were estimated using the Black-Scholes option-pricing model with the
following assumptions:
|
|
|
|
|
|
|
|
|
|
|
|
|
Fiscal year ended
January 31, |
|
|
|
2015 |
|
2016 |
|
2017 |
|
Expected life (years) |
|
|
6.25 |
|
|
6.25 |
|
|
6.25 |
|
Expected volatility |
|
|
54.55 |
% |
|
52.54 |
% |
|
52.00 |
% |
Dividend yield |
|
|
0.00 |
% |
|
0.00 |
% |
|
0.00 |
% |
Risk-free rate |
|
|
1.02 |
% |
|
1.79 |
% |
|
1.66 |
% |
F-28
Table of Contents
YEXT, INC.
NOTES TO CONSOLIDATED FINANCIAL STATEMENTS (Continued)
8. Stock-Based Compensation (Continued)
Stock Options
Option activity is as follows:
|
|
|
|
|
|
|
|
|
|
|
|
|
|
|
|
Outstanding
Stock Options |
|
Weighted-Average
Exercise Price |
|
Weighted-Average
Remaining
Contractual
Term (in years) |
|
Aggregate
Intrinsic
Value |
|
Balance as of January 31, 2015 |
|
|
18,254,386 |
|
$ |
2.44 |
|
|
|
|
|
|
|
Granted |
|
|
3,599,000 |
|
|
5.18 |
|
|
|
|
|
|
|
Exercised |
|
|
(263,126 |
) |
|
1.71 |
|
|
|
|
|
|
|
Forfeited or cancelled |
|
|
(1,750,591 |
) |
|
2.56 |
|
|
|
|
|
|
|
|
|
|
|
|
|
|
|
|
|
|
|
|
|
|
Balance as of January 31, 2016 |
|
|
19,839,669 |
|
|
3.03 |
|
|
6.64 |
|
$ |
66,530,370 |
|
|
|
|
|
|
|
|
|
|
|
|
|
|
|
|
Granted |
|
|
9,702,800 |
|
|
6.67 |
|
|
|
|
|
|
|
Exercised |
|
|
(617,770 |
) |
|
2.13 |
|
|
|
|
|
|
|
Forfeited or cancelled |
|
|
(1,504,591 |
) |
|
4.76 |
|
|
|
|
|
|
|
|
|
|
|
|
|
|
|
|
|
|
|
|
|
|
Balance as of January 31, 2017 |
|
|
27,420,108 |
|
$ |
4.24 |
|
|
6.87 |
|
$ |
122,803,172 |
|
|
|
|
|
|
|
|
|
|
|
|
|
|
|
|
|
|
|
|
|
|
|
|
|
|
|
|
|
|
|
|
|
|
|
|
|
|
|
|
|
|
|
|
|
|
Vested and expected to vest at January 31, 2016 |
|
|
19,608,292 |
|
$ |
3.01 |
|
|
6.51 |
|
$ |
66,109,092 |
|
Exercisable at January 31, 2016 |
|
|
12,282,578 |
|
|
2.54 |
|
|
5.33 |
|
$ |
49,294,689 |
|
Vested and expected to vest at January 31, 2017 |
|
|
26,979,141 |
|
|
4.21 |
|
|
6.88 |
|
$ |
121,821,813 |
|
Exercisable at January 31, 2017 |
|
|
14,580,059 |
|
|
2.79 |
|
|
5.04 |
|
$ |
88,057,465 |
|
Nonvested
option activity is as follows:
|
|
|
|
|
|
|
|
|
|
|
|
Weighted-Average |
|
|
|
|
|
Grant Date |
|
|
|
Options |
|
Fair Value |
|
Nonvested as of January 31, 2015 |
|
|
7,423,325 |
|
$ |
1.46 |
|
Options granted |
|
|
3,599,000 |
|
|
2.87 |
|
Vested |
|
|
(2,852,903 |
) |
|
1.44 |
|
Forfeited |
|
|
(552,656 |
) |
|
1.67 |
|
|
|
|
|
|
|
|
|
|
Balance as of January 31, 2016 |
|
|
7,616,766 |
|
|
2.14 |
|
|
|
|
|
|
|
|
|
|
Options granted |
|
|
9,702,800 |
|
|
3.57 |
|
Vested |
|
|
(3,212,782 |
) |
|
1.98 |
|
Forfeited |
|
|
(1,240,939 |
) |
|
2.77 |
|
|
|
|
|
|
|
|
|
|
Balance as of January 31, 2017 |
|
|
12,865,845 |
|
$ |
3.18 |
|
|
|
|
|
|
|
|
|
|
|
|
|
|
|
|
|
|
|
|
|
|
|
|
|
|
|
|
The
total intrinsic value of the options exercised during the fiscal years ended January 31, 2015, 2016 and 2017 was less than $0.2 million, $0.9 million and
$2.8 million, respectively. The intrinsic value is the difference between the current market value of the stock and the exercise price of the stock options.
The
total fair value of shares vested during the fiscal years ended January 31, 2015, 2016 and 2017 was $3.1 million, $4.2 million and $6.5 million,
respectively.
F-29
Table of Contents
YEXT, INC.
NOTES TO CONSOLIDATED FINANCIAL STATEMENTS (Continued)
8. Stock-Based Compensation (Continued)
At
January 31, 2015, 2016 and 2017, the Company had reserved shares of common stock, on an as-converted basis, for future issuance as follows:
|
|
|
|
|
|
|
|
|
|
|
|
|
Fiscal year ended
January 31, |
|
|
|
2015 |
|
2016 |
|
2017 |
|
Conversion of convertible preferred stock |
|
|
43,594,753 |
|
|
43,594,753 |
|
|
43,594,753 |
|
Warrants to purchase series B convertible preferred stock |
|
|
67,568 |
|
|
67,568 |
|
|
67,568 |
|
Warrants to purchase series C convertible preferred stock |
|
|
43,369 |
|
|
43,369 |
|
|
43,369 |
|
Warrants to purchase common stock |
|
|
85,000 |
|
|
85,000 |
|
|
85,000 |
|
Stock options outstanding |
|
|
18,254,386 |
|
|
19,839,669 |
|
|
27,420,108 |
|
RSUs outstanding |
|
|
— |
|
|
40,000 |
|
|
330,000 |
|
Shares available for future grants of equity awards |
|
|
1,779,344 |
|
|
2,951,250 |
|
|
7,713,041 |
|
|
|
|
|
|
|
|
|
|
|
|
|
Total |
|
|
63,824,420 |
|
|
66,621,609 |
|
|
79,253,839 |
|
|
|
|
|
|
|
|
|
|
|
|
|
|
|
|
|
|
|
|
|
|
|
|
|
|
|
|
|
|
|
|
|
|
|
|
|
Stock-Based Compensation
Stock-based compensation represents the cost related to stock-based awards granted to employees and non-employees in lieu of monetary payment.
The Company measures stock-based compensation cost at the grant date, based on the estimated fair value of the award, and recognizes the cost as expense on a straight-line basis (net of estimated
forfeitures) over the requisite service period. The expense is recorded in the consolidated statements of operations and comprehensive loss. The Company's share-based compensation for the fiscal years
ended January 31, 2015, 2016 and 2017 were as follows (in thousands):
|
|
|
|
|
|
|
|
|
|
|
|
|
Fiscal year ended
January 31, |
|
|
|
2015 |
|
2016 |
|
2017 |
|
Cost of revenues |
|
$ |
399 |
|
$ |
533 |
|
$ |
590 |
|
Sales and marketing |
|
|
920 |
|
|
1,559 |
|
|
4,359 |
|
Research and development |
|
|
1,104 |
|
|
1,300 |
|
|
1,954 |
|
General and administrative |
|
|
480 |
|
|
1,115 |
|
|
2,948 |
|
|
|
|
|
|
|
|
|
|
|
|
|
Total stock-based compensation |
|
$ |
2,903 |
|
$ |
4,507 |
|
$ |
9,851 |
|
|
|
|
|
|
|
|
|
|
|
|
|
|
|
|
|
|
|
|
|
|
|
|
|
|
|
|
|
|
|
|
|
|
|
|
|
Total
unrecognized compensation cost related to unvested stock options for the fiscal year ended January 31, 2017 was $37.8 million. This cost is expected to be recognized
over the remaining weighted-average vesting period, which was 3.44 years as of January 31, 2017.
Restricted Stock Units
The Company granted 40,000 RSUs during the fiscal year ended January 31, 2016 and 290,000 RSUs during the fiscal year ended
January 31, 2017. Each RSU generally vests over a one to three year period.
RSUs
are valued at the fair value of the Company's common stock as of the date of grant. The Company's Board of Directors utilizes independent valuations and other available information
when estimating the value of the stock underlying the granted restricted stock units. The weighted-average estimated fair value per share of RSUs granted during the fiscal years ended
January 31, 2016 and 2017 was $6.08 and $6.61, respectively.
F-30
Table of Contents
YEXT, INC.
NOTES TO CONSOLIDATED FINANCIAL STATEMENTS (Continued)
8. Stock-Based Compensation (Continued)
The
Company recognized less than $0.1 million of compensation cost related to RSUs during the fiscal year ended January 31, 2016 and $1.0 million of compensation
cost during the fiscal year ended January 31, 2017. Total unrecognized compensation cost related to unvested stock options for the years ended January 31, 2016 and 2017 was
$0.2 million and $1.4 million, respectively. This cost is expected to be recognized over the remaining weighted-average vesting period, which was 1.13 years as of
January 31, 2016 and 1.82 years as of January 31, 2017.
9. Debt
On March 16, 2016, the Company entered into a Loan and Security agreement with Silicon Valley Bank that provides for a $15.0 million revolving credit line ("Revolving
Line") and a $7.0 million Letter of Credit ("Letter of Credit" and, together with the Revolving Line, the "Credit Agreement"). The Credit Agreement matures on March 16, 2018. No
significant debt issuance costs were incurred as part of the transaction. The Company is obligated to pay ongoing commitment fees at a rate equal to 0.25% for the Revolving Line and 1.75% for any
issued letters of credit.
Subject
to certain terms of the loan agreement, the Company may borrow, prepay and reborrow amounts under the Revolving Line at any time during the agreement and amounts repaid or
prepaid may be reborrowed. Interest rates on borrowings under the Revolving Line will be based on one-half of one percent (0.50%) above the prime rate. The prime rate is defined as the rate of
interest per annum from time to time published in the money rate section of the Wall Street Journal.
The
Credit Agreement contains certain customary affirmative and negative covenants, including an adjusted quick ratio of at least 1.25 to 1.00, minimum revenue, a limit on the Company's
ability to incur additional indebtedness, dispose of assets, make certain acquisition transactions, pay dividends or make distributions, and certain other restrictions on the Company's activities each
defined specifically in the agreement.
On
November 18, 2016, the Company drew $5.0 million on its Revolving Line for strategic operating purposes. As of January 31, 2017, the Company classified the
$5.0 million outstanding on the Revolving Line as long term debt on its consolidated balance sheet, and its book value approximates its fair value.
10. Income Taxes
The benefit from income taxes is comprised of domestic and international income taxes. The following table presents the domestic and international components of the loss from operations
before income taxes of $17.3 million, $26.6 million and $43.1 million for the fiscal years ended January 31, 2015, 2016 and 2017, respectively (in thousands):
|
|
|
|
|
|
|
|
|
|
|
|
|
Fiscal year ended
January 31, |
|
|
|
2015 |
|
2016 |
|
2017 |
|
Domestic |
|
$ |
(17,032 |
) |
$ |
(24,546 |
) |
$ |
(41,621 |
) |
International |
|
|
(241 |
) |
|
(2,004 |
) |
|
(1,461 |
) |
|
|
|
|
|
|
|
|
|
|
|
|
Loss from operations before income taxes |
|
$ |
(17,273 |
) |
$ |
(26,550 |
) |
$ |
(43,082 |
) |
|
|
|
|
|
|
|
|
|
|
|
|
|
|
|
|
|
|
|
|
|
|
|
|
|
|
|
|
|
|
|
|
|
|
|
|
F-31
Table of Contents
YEXT, INC.
NOTES TO CONSOLIDATED FINANCIAL STATEMENTS (Continued)
10. Income Taxes (Continued)
The benefit from (provision for) income taxes is composed of the following (in thousands):
|
|
|
|
|
|
|
|
|
|
|
|
|
Fiscal year ended
January 31, |
|
|
|
2015 |
|
2016 |
|
2017 |
|
Current: |
|
|
|
|
|
|
|
|
|
|
Federal |
|
$ |
— |
|
$ |
— |
|
$ |
— |
|
State |
|
|
— |
|
|
— |
|
|
— |
|
International |
|
|
— |
|
|
(1,002 |
) |
|
(37 |
) |
|
|
|
|
|
|
|
|
|
|
|
|
Total |
|
|
— |
|
|
(1,002 |
) |
|
(37 |
) |
Deferred: |
|
|
|
|
|
|
|
|
|
|
Federal |
|
|
— |
|
|
— |
|
|
— |
|
State |
|
|
— |
|
|
— |
|
|
— |
|
International |
|
|
— |
|
|
1,057 |
|
|
(31 |
) |
|
|
|
|
|
|
|
|
|
|
|
|
Total |
|
|
— |
|
|
1,057 |
|
|
(31 |
) |
|
|
|
|
|
|
|
|
|
|
|
|
Total benefit from (provision for) income taxes |
|
$ |
— |
|
$ |
55 |
|
$ |
(68 |
) |
|
|
|
|
|
|
|
|
|
|
|
|
|
|
|
|
|
|
|
|
|
|
|
|
|
|
|
|
|
|
|
|
|
|
|
|
A
reconciliation of the Company's income taxes at the U.S. federal statutory rate to the benefit from (provision for) income taxes is as follows (dollars in thousands):
|
|
|
|
|
|
|
|
|
|
|
|
|
Fiscal year ended
January 31, |
|
|
|
2015 |
|
2016 |
|
2017 |
|
U.S. federal tax benefit at statutory rate |
|
$ |
6,046 |
|
$ |
9,027 |
|
$ |
14,648 |
|
State taxes, net of federal benefit |
|
|
525 |
|
|
493 |
|
|
990 |
|
Foreign tax rate differential |
|
|
(24 |
) |
|
(249 |
) |
|
(253 |
) |
Non-deductible expenses |
|
|
(600 |
) |
|
(2,004 |
) |
|
(1,549 |
) |
Changes in valuation allowance |
|
|
(5,947 |
) |
|
(6,317 |
) |
|
(13,805 |
) |
Rate change |
|
|
— |
|
|
(694 |
) |
|
(52 |
) |
Other, net |
|
|
— |
|
|
(201 |
) |
|
(47 |
) |
|
|
|
|
|
|
|
|
|
|
|
|
Total benefit from (provision for) income taxes |
|
$ |
— |
|
$ |
55 |
|
$ |
(68 |
) |
|
|
|
|
|
|
|
|
|
|
|
|
|
|
|
|
|
|
|
|
|
|
|
|
|
|
|
|
|
|
|
|
|
|
|
|
Effective tax rate |
|
|
— |
% |
|
(0.2 |
)% |
|
0.2% |
|
Deferred
income taxes reflect the net tax effects of (a) temporary differences between the carrying amounts of assets and liabilities for financial reporting purposes and the
amounts used for income tax
F-32
Table of Contents
YEXT, INC.
NOTES TO CONSOLIDATED FINANCIAL STATEMENTS (Continued)
10. Income Taxes (Continued)
purposes,
and (b) operating losses carryforwards. Components of the Company's deferred tax assets and liabilities were as follows (in thousands):
|
|
|
|
|
|
|
|
|
|
Fiscal year ended
January 31, |
|
|
|
2016 |
|
2017 |
|
Deferred tax assets: |
|
|
|
|
|
|
|
Net operating loss carryforwards |
|
$ |
29,660 |
|
$ |
42,421 |
|
Stock-based compensation |
|
|
515 |
|
|
3,794 |
|
Allowance for doubtful accounts |
|
|
196 |
|
|
74 |
|
Deferred rent |
|
|
2,233 |
|
|
1,948 |
|
Accrued expenses |
|
|
727 |
|
|
312 |
|
Intangible assets |
|
|
147 |
|
|
149 |
|
Deferred revenue |
|
|
142 |
|
|
62 |
|
Other |
|
|
13 |
|
|
58 |
|
|
|
|
|
|
|
|
|
|
Total deferred tax assets |
|
|
33,633 |
|
|
48,818 |
|
Less valuation allowance |
|
|
(30,744 |
) |
|
(44,549 |
) |
|
|
|
|
|
|
|
|
|
Deferred tax assets, net of valuation allowance |
|
|
2,889 |
|
|
4,269 |
|
Deferred tax liabilities: |
|
|
|
|
|
|
|
Prepaid expenses |
|
|
(138 |
) |
|
(40 |
) |
Fixed assets |
|
|
(1,906 |
) |
|
(1,319 |
) |
Deferred commissions |
|
|
(945 |
) |
|
(2,952 |
) |
Intangible assets |
|
|
(36 |
) |
|
(126 |
) |
|
|
|
|
|
|
|
|
|
Total deferred tax liabilities |
|
|
(3,025 |
) |
|
(4,437 |
) |
|
|
|
|
|
|
|
|
|
Net deferred tax liability |
|
$ |
(136 |
) |
$ |
(168 |
) |
|
|
|
|
|
|
|
|
|
|
|
|
|
|
|
|
|
|
|
|
|
|
|
|
|
|
|
As
of January 31, 2017, the Company had $119.6 million of gross U.S. federal NOL carryforwards available to offset future taxable income, which expire in fiscal 2028
through fiscal 2037. For state income tax purposes, the Company had $5.2 million of post-apportioned, tax-effected NOL carryforwards, which expire in fiscal 2025 through fiscal 2037. The
Company had $0.3 million of tax-effected foreign NOL carryforwards, of which less than $0.1 million expire in fiscal 2024 through fiscal 2026; the remaining do not expire. Utilization of
the Company's NOL carryforwards in the future will be dependent upon the Company's ability to generate taxable income and could be limited due to ownership changes, as defined under the provisions of
Section 382 of the Code and similar state provisions. Utilization of the Company's foreign NOL carryforwards in the future will be dependent upon the local tax law and regulation.
Excess
tax benefits associated with stock option exercises are recorded directly to additional paid-in-capital only when such benefits are realized. As a result, the excess tax benefits
included in the gross NOL carryforwards at January 31, 2017 but not reflected in deferred tax assets for fiscal 2017 were approximately $5.8 million.
The
Company regularly evaluates the realizability of its deferred tax assets and establishes a valuation allowance if it is more likely than not that some or all of its deferred tax
assets will not be realized. In making such a determination, the Company considers all available positive and negative evidence,
F-33
Table of Contents
YEXT, INC.
NOTES TO CONSOLIDATED FINANCIAL STATEMENTS (Continued)
10. Income Taxes (Continued)
including
future reversals of existing taxable temporary differences, projected future taxable income, tax-planning strategies and results of recent operations. Generally, more weight is given to
objectively verifiable evidence, such as the cumulative loss in recent years as a significant piece of negative evidence to overcome. During fiscal 2016 and 2017, the valuation allowance increased by
$6.3 million and $13.8 million, respectively, primarily due to increases in NOL carryforwards and other U.S. deferred tax assets. The Company will continue to assess the realizability of
the deferred tax assets in each applicable jurisdictions going forward.
The
following table summarizes the valuation allowance activity for the periods indicated (in thousands):
|
|
|
|
|
|
|
|
|
|
Fiscal year ended
January 31, |
|
|
|
2016 |
|
2017 |
|
Balance as of the beginning of the period |
|
$ |
24,427 |
|
$ |
30,744 |
|
Additions charged to expense |
|
|
6,337 |
|
|
13,832 |
|
Deletions credited to expense |
|
|
— |
|
|
— |
|
Currency translation |
|
|
(20 |
) |
|
(27 |
) |
|
|
|
|
|
|
|
|
|
Balance as of the end of the period |
|
$ |
30,744 |
|
$ |
44,549 |
|
|
|
|
|
|
|
|
|
|
|
|
|
|
|
|
|
|
|
|
|
|
|
|
|
|
|
|
The
Company does not provide for federal income taxes on the undistributed earnings of its foreign subsidiaries as such earnings are determined to be reinvested indefinitely. Upon
distribution of those earnings in the form of dividends or otherwise, the Company may be subject to U.S. federal and state income taxes, the determination of which is not practical as it is dependent
on the amount of U.S. tax losses or other tax attributes available at the time of repatriation. As of January 31, 2016 and 2017, undistributed earnings of the Company's foreign subsidiaries
amounted to less than $0.1 million, and $0.1 million, respectively.
Prior
to fiscal 2016, the Company had not taken any uncertain tax positions. During fiscal 2016, the Company recorded a liability for unrecognized tax benefits equal to
$0.2 million in connection with an uncertain tax position related to an intercompany transfer of certain intangible assets. During fiscal 2017, the Company did not record any new liabilities
for unrecognized tax benefits.
The
Company has accrued less than $0.1 million for interest and penalties related to unrecognized tax benefits during fiscal 2017. No such amounts were accrued during fiscal 2016.
The Company does not expect any significant change in its unrecognized tax benefits during the next twelve months.
F-34
Table of Contents
YEXT, INC.
NOTES TO CONSOLIDATED FINANCIAL STATEMENTS (Continued)
10. Income Taxes (Continued)
The Company is subject to taxation in the United States and various state and foreign jurisdictions. The Company's most significant operations are in the United States and the earliest
open tax year subject to potential examination in the United States is 2008.
11. Commitments and Contingencies
Leases and PowerListings Network Application Providers Agreements
The Company is obligated under certain non-cancelable operating leases for office space, the agreements for which expire at various dates
between fiscal years 2017 and 2022, including a long-term operating lease for the Company's primary facility in New York which expires in December 2020. The Company is a party to various agreements
with PowerListings Network application providers, the agreements for which expire at various dates between fiscal years 2018 and 2020.
Future
minimum annual payments for non-cancelable leases and PowerListings Network application providers agreements are as follows (in thousands):
|
|
|
|
|
|
|
|
|
|
As of January 31, 2017 |
|
Fiscal year ending January 31:
|
|
Application
Providers |
|
Operating
Leases |
|
2018 |
|
$ |
13,964 |
|
$ |
6,905 |
|
2019 |
|
|
4,407 |
|
|
6,969 |
|
2020 |
|
|
1,100 |
|
|
7,130 |
|
2021 |
|
|
— |
|
|
6,837 |
|
2022 |
|
|
— |
|
|
441 |
|
Thereafter |
|
|
— |
|
|
|
|
|
|
|
|
|
|
|
|
|
|
|
$ |
19,471 |
|
$ |
28,282 |
|
|
|
|
|
|
|
|
|
|
|
|
|
|
|
|
|
|
|
|
|
|
|
|
|
|
|
|
Rent
expense was $3.7 million, $5.5 million and $5.8 million for the fiscal years ended January 31, 2015, 2016 and 2017, respectively.
Legal Proceedings
The Company is a defendant in a case pending in the United States District Court for the Southern District of New York, captioned Tropical Sails Corp. v. Yext, Inc., civil action no. 14-cv-7582. The plaintiffs allege various violations of New York law related to
certain of the Company's sales practices. On May 18, 2015, the Court dismissed two of the four counts alleged by plaintiffs. On March 11, 2016, the plaintiffs filed a Motion for Class
Certification, and the Company filed a Motion for Summary Judgment as to the remaining counts. At the time of issuance, the motions have been fully briefed and discovery has been stayed pending a
ruling from the Court. A hearing was held in February 2017. The Company believes the plaintiffs' claims are without merit and intends to vigorously defend itself. At this time an outcome cannot be
predicted. No loss has been provided for this matter.
In
addition, the Company is and may be involved in various legal proceedings arising from the normal course of business activities. Although the results of litigation and claims cannot
be predicted with certainty, currently, in the opinion of the Company, the likelihood of any material adverse impact on the Company's consolidated results of operations, cash flows or the Company's
financial position for any such
F-35
Table of Contents
YEXT, INC.
NOTES TO CONSOLIDATED FINANCIAL STATEMENTS (Continued)
11. Commitments and Contingencies (Continued)
litigation
or claims is deemed to be remote. Regardless of the outcome, litigation can have an adverse impact on the Company because of defense costs, diversion of management resources and other
factors.
Warranties and Indemnification
The Company's platform is in some cases warranted to perform in a manner consistent with general industry standards that are reasonably
applicable and materially in accordance with the Company's product specifications.
The
Company's arrangements generally include certain provisions for indemnifying customers against liabilities if its products or services infringe a third party's intellectual property
rights and/or if the Company breaches its contractual agreements with a customer or in instances of negligence, fraud or willful misconduct by the Company. To date, the Company has not incurred any
material costs as a result of such obligations and has not accrued any liabilities related to such obligations in the accompanying consolidated financial statements.
The
Company has also agreed to indemnify certain of its directors and executive officers for costs associated with any fees, expenses, judgments, fines and settlement amounts incurred by
any of these persons in any action or proceeding to which any of those persons is, or is threatened to be, made a party by reason of the person's service as a director or officer, including any action
by the Company, arising out of that person's services as the Company's director or officer or that person's services provided to any other company or enterprise at the Company's request. The Company
maintains director and officer insurance coverage that would generally enable the Company to recover a portion of any future amounts paid. The Company may also be subject to indemnification
obligations by law with respect to the actions of its employees under certain circumstances and in certain jurisdictions.
12. Net Loss Per Share Attributable to Common Stockholders and Unaudited Pro Forma Net Loss Per Share
The following table sets forth the computation of basic and diluted net loss per share attributable to common stockholders as discussed in Note 2, "Summary of Significant
Accounting Policies—Net Loss Per Share" (in thousands, except share and per share amounts):
|
|
|
|
|
|
|
|
|
|
|
|
|
Fiscal year ended January 31, |
|
|
|
2015 |
|
2016 |
|
2017 |
|
Numerator: |
|
|
|
|
|
|
|
|
|
|
Net loss attributable to common stockholders |
|
$ |
(17,273 |
) |
$ |
(26,495 |
) |
$ |
(43,150 |
) |
|
|
|
|
|
|
|
|
|
|
|
|
|
|
|
|
|
|
|
|
|
|
|
|
|
|
|
|
|
|
|
|
|
|
|
|
Denominator: |
|
|
|
|
|
|
|
|
|
|
Weighted-average common shares outstanding |
|
|
28,519,917 |
|
|
29,917,814 |
|
|
31,069,695 |
|
|
|
|
|
|
|
|
|
|
|
|
|
|
|
|
|
|
|
|
|
|
|
|
|
|
|
|
|
|
|
|
|
|
|
|
|
Net loss per share attributable to common stockholders, basic and diluted |
|
$ |
(0.61 |
) |
$ |
(0.89 |
) |
$ |
(1.39 |
) |
|
|
|
|
|
|
|
|
|
|
|
|
|
|
|
|
|
|
|
|
|
|
|
|
|
|
|
|
|
|
|
|
|
|
|
|
Basic
net loss per share is computed by dividing the net loss attributable to common stockholders by the weighted average number of common shares outstanding during the period. Diluted
net loss per share is computed by dividing the net loss attributable to common stockholders by the weighted average number of common shares plus common equivalent shares for the period, including any
dilutive effect from such shares. Common equivalent shares are convertible preferred stock, convertible preferred stock warrants, shares issuable upon the exercise of stock options and unvested shares
of restricted stock units.
F-36
Table of Contents
YEXT, INC.
NOTES TO CONSOLIDATED FINANCIAL STATEMENTS (Continued)
12. Net Loss Per Share Attributable to Common Stockholders and Unaudited Pro Forma Net Loss Per Share (Continued)
Since
the Company was in a loss position for all periods presented, basic net loss per share attributable to common stockholders is the same as diluted net loss per share attributable to
common stockholders for all periods as the inclusion of all potential common shares outstanding would have been anti-dilutive. Anti-dilutive common equivalent shares were as follows:
|
|
|
|
|
|
|
|
|
|
|
|
|
Fiscal year ended January 31, |
|
|
|
2015 |
|
2016 |
|
2017 |
|
Convertible preferred stock as converted |
|
|
43,594,753 |
|
|
43,594,753 |
|
|
43,594,753 |
|
Series B warrants |
|
|
67,568 |
|
|
67,568 |
|
|
67,568 |
|
Series C warrants |
|
|
43,369 |
|
|
43,369 |
|
|
43,369 |
|
Common stock warrants |
|
|
85,000 |
|
|
85,000 |
|
|
85,000 |
|
Options to purchase common stock |
|
|
18,254,386 |
|
|
19,839,669 |
|
|
27,420,108 |
|
RSUs outstanding |
|
|
— |
|
|
40,000 |
|
|
330,000 |
|
|
|
|
|
|
|
|
|
|
|
|
|
Total |
|
|
62,045,076 |
|
|
63,670,359 |
|
|
71,540,798 |
|
|
|
|
|
|
|
|
|
|
|
|
|
|
|
|
|
|
|
|
|
|
|
|
|
|
|
|
|
|
|
|
|
|
|
|
|
Unaudited Pro Forma Net Loss Per Share
The unaudited pro forma basic and diluted net loss per share attributable to common stockholders has been computed to give effect to the assumed
automatic conversion of the convertible preferred stock into shares of common stock using the if converted method upon the completion of a qualifying IPO as though the conversion had occurred as of
the beginning of the period, or original date of issuance if later.
The
following table sets forth the computation of the Company's unaudited pro forma basic and diluted net loss per share attributable to common stockholders for the period indicated (in
thousands, except share and per share amounts):
|
|
|
|
|
|
|
Fiscal year ended
January 31,
2017 |
|
|
|
(unaudited)
|
|
Numerator: |
|
|
|
|
Pro forma net loss attributable to common stockholders, basic and diluted |
|
$ |
(43,150 |
) |
|
|
|
|
|
|
|
|
|
|
|
|
|
|
|
|
|
|
Denominator: |
|
|
|
|
Weighted-average shares used in computing net loss per share attributable to common stockholders, basic and
diluted |
|
|
31,069,695 |
|
Pro forma adjustment to reflect assumed conversion of convertible preferred stock into common stock |
|
|
43,594,753 |
|
|
|
|
|
|
|
Weighted-average number of shares used in computing pro forma net loss per share, attributable to common stockholders,
basic and diluted |
|
|
74,664,448 |
|
|
|
|
|
|
|
|
|
|
|
|
|
|
|
|
|
|
|
Pro forma net loss per share, basic and diluted |
|
$ |
(0.58 |
) |
|
|
|
|
|
|
|
|
|
|
|
|
|
|
|
|
|
|
F-37
Table of Contents
YEXT, INC.
NOTES TO CONSOLIDATED FINANCIAL STATEMENTS (Continued)
13. Subsequent Events
The Company has assessed subsequent events through March 17, 2017, which was the date the consolidated financial statements were available to be issued, and has concluded the
following required disclosure in the consolidated financial statements.
On
March 15, 2017, the Company granted to its employees options to purchase an aggregate of 694,250 shares of common stock, with vesting in each case based on continued service.
The fair value of the stock options granted is estimated at $3.5 million in the aggregate and will be recognized as stock-based compensation expense over the four year service period.
14. Subsequent Events (unaudited)
As discussed in Note 11, "Commitments and Contingencies," the Company is a defendant in a case pending in the United States District Court for the Southern District of New York,
captioned Tropical Sails Corp. v. Yext, Inc., civil action no. 14-cv-7582. Subsequent to the time of issuance, in March 2017,
the Court denied the plaintiffs' Motion for Class Certification and the Company's Motion for Summary Judgment. In April 2017, the Company entered into a settlement agreement pursuant to which the case
will be dismissed with prejudice.
Subsequent
to the time of issuance, in March 2017, the Company's Board of Directors adopted and the Company's stockholders approved the Company's 2017 Employee Stock Purchase Plan, or
the ESPP, which became effective on the date it was adopted by the Company's Board of Directors. A total of 1,500,000 shares of the Company's common stock are available for sale under the ESPP. The
number of shares of the Company's common stock that will be available for sale under the ESPP also includes an annual increase on the first day of each fiscal year beginning on February 1,
2018, equal to the least of: 2,500,000 shares; 1% of the outstanding shares of the Company's common stock as of the last day of the immediately preceding fiscal year; or such other amount as the
administrator may determine.
Subsequent
to the time of issuance, in March 2017, the Company granted to its employees options to purchase an aggregate of 105,000 shares of common stock, with vesting in each case
based on continued service. The fair value of the stock options granted is estimated at $0.5 million in the aggregate and will be recognized as stock-based compensation expense over the four
year service period.
F-38
Table of Contents
Table of Contents